1
Neuroacoustics, Darmstadt University of Technology, Darmstadt, Germany
2
Institute for Neuroinformatics, Department of Theoretical Biology, Neural Plasticity Laboratory, Ruhr-University Bochum, Bochum, Germany
3
Neuroscience and Human Performance, Jacobs Center on Lifelong Learning, Jacobs University, Bremen, Germany
Harmonic sounds, such as voiced speech sounds and many animal communication signals, are characterized by a pitch related to the periodicity of their envelopes. While frequency information is extracted by mechanical filtering of the cochlea, periodicity information is analyzed by temporal filter mechanisms in the brainstem. In the mammalian auditory midbrain envelope periodicity is represented in maps orthogonal to the representation of sound frequency. However, how periodicity is represented across the cortical surface of primary auditory cortex (AI) remains controversial. Using optical recording of intrinsic signals, we here demonstrate that a periodicity map exists in primary AI of the cat. While pure tone stimulation confirmed the well-known frequency gradient along the rostro-caudal axis of AI, stimulation with harmonic sounds revealed segregated bands of activation, indicating spatially localized preferences to specific periodicities along a dorso-ventral axis, nearly orthogonal to the tonotopic gradient. Analysis of the response locations revealed an average gradient of −100° ± 10° for the periodotopic, and −12° ± 18° for the tonotopic map resulting in a mean angle difference of 88°. The gradients were 0.65 ± 0.08 mm/octave for periodotopy and 1.07 ± 0.16 mm/octave for tonotopy indicating that more cortical territory is devoted to the representation of an octave along the tonotopic than along the periodotopic gradient. Our results suggest that the fundamental importance of pitch, as evident in human perception, is also reflected in the layout of cortical maps and that the orthogonal spatial organization of frequency and periodicity might be a more general cortical organization principle.
Perceptually, acoustic signals in speech, music, and animal communication are characterized by a pitch. Sound sources such as strings and tubes, as well as vocal chords, vibrate periodically and emit so-called harmonic sounds, which are characterized by periodic envelope modulations. Temporally, a harmonic signal is characterized by an envelope with a frequency equal to the frequency of its fundamental component. Spectrally, these signals are characterized by a series of harmonics, which are integer multiples of the fundamental frequency (Figure 1
). In order to understand the auditory processing of harmonic sounds one has to take into account that the first processing stage, the cochlea, performs a frequency analysis. From the beginning of modern hearing research this analysis was compared to a Fourier analysis (von Helmholtz, 1863
). However, it turned out that the underlying travelling wave mechanism produces filters, which are broad enough to transmit several adjacent harmonics, provided the fundamental frequency of the sound is lower than about ¼ of the centre of the frequency filters. For such fundamentals the travelling wave at the filter location beats with a frequency equal to the fundamental frequency, because all harmonics differ by a frequency equal to the fundamental frequency. As a result, spike trains in the auditory nerve show phase coupling to these beats and therefore transfer temporal information about the fundamental frequency (Palmer, 1982
), even when the fundamental frequency component is ‘missing’. Perceptually, irrespective of their spectral content, all harmonic sounds with the same envelope periodicity have the same pitch. This percept, related to the envelope periodicity is called ‘periodicity pitch’ or – in absence of the fundamental component – the percept of the ‘missing fundamental’ (Schouten et al., 1962
). A more or less salient periodicity pitch is obtained only in the spectral range below 5 kHz, where auditory nerve fibers faithfully transmit temporal information and the pitch saliency improves when the neuronal analysis has access to at least partly resolved components of a harmonic sound (Langner, 1992
; Pressnitzer et al. 2001
).
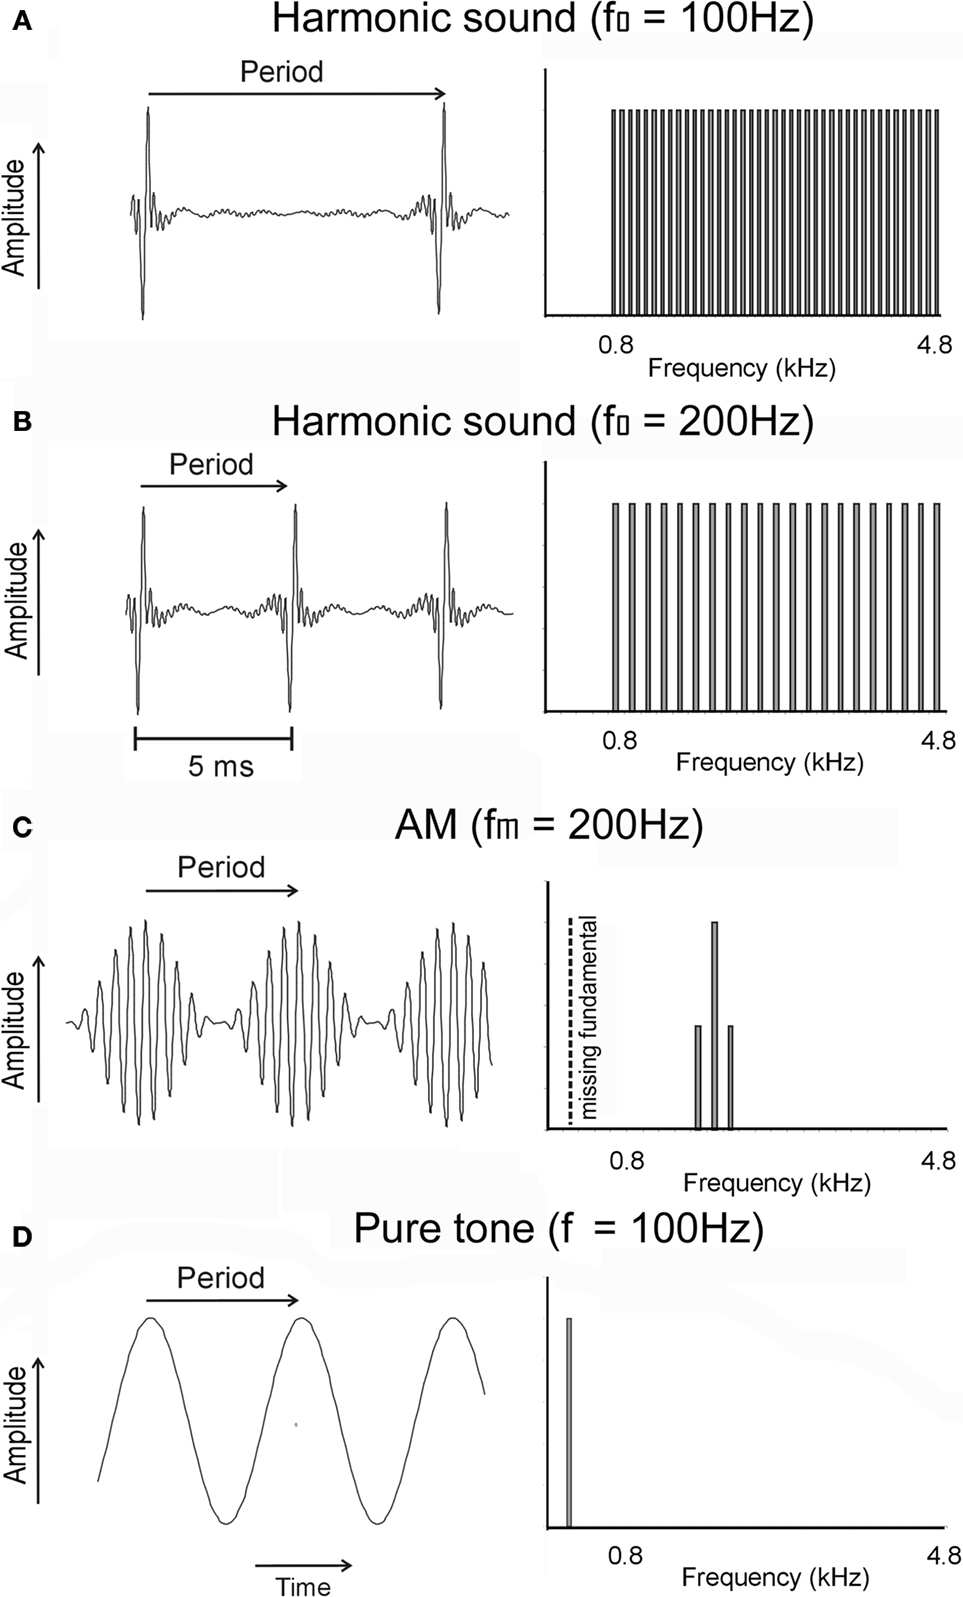
Figure 1. Temporal (left) and spectral (right) representation of examples of signals used to determine the layout of frequency and periodicity maps. (A) A harmonic sound composed of periodic pulses with a periodicity of 100 Hz, corresponding to a repetition period of 10 ms. The signal extends from 0.8 to 4.8 kHz; the fundamental frequency of 100 Hz and the harmonics below 800 Hz were filtered out. (B) The same stimulus as in (A), but with a fundamental frequency of 200 Hz, corresponding to a period of 5 ms. Other harmonic sounds used in the experiments differed in fundamental frequency (25–1200 Hz) or cut-off frequency (0.4–1.2 kHz; see Materials and Methods). (C) An AM (amplitude modulation) sound with a carrier frequency of 1.8 kHz and a modulation frequency of 200 Hz, corresponding to a modulation (or envelope) period of 5 ms. (D) A pure tone with a frequency of 200 Hz corresponding to a period of 5 ms. Other tone frequencies used in the experiments were located between 0.8 and 12.8 kHz.
The omnipresence of harmonic sounds in nature is the reason why animals and humans have evolved auditory mechanisms which are specialized to process such sounds. For example, in the auditory midbrain neurons are tuned to different periodicities (Rees and Palmer, 1988
; Schreiner and Langner, 1988
; Langner, 1992
; Müller-Preuss et al., 1994
; Heil et al., 1995
; Krishna and Semple, 2000
; Langner et al., 2002
) and the existence of a map of periodicity orthogonal to the frequency representation has been demonstrated in different animals (Schreiner and Langner, 1988
; Langner, 1992
; Heil et al., 1995
; Langner et al., 2002
; Rees and Langner, 2005
). However, it still remains a controversial question whether there are maps of periodicity at the level of primary auditory cortex (AI), and if so, how periodicity is represented across the cortical surface (Pantev et al., 1989
; Langner et al., 1997
; Schulze and Langner, 1997
; Schulze et al., 2002
; Langner, 2005
). While recent studies support the view that periodicity processing occurs in subcortical structures (Gutschalk et al., 2004
), the contribution of the AI to higher-order auditory processing remains unclear (Cansino et al., 2003
; Hertrich et al., 2004
; Penagos et al., 2004
). Bendor and Wang (2005)
found so-called ‘pitch neurons’ in marmosets, but these were localized in a presumably non-primary field bordering low frequency AI. It is important to realize that neurons in a periodicity or tonotopic map prefer a certain periodicity (pitch) or frequency, respectively, but they do respond also to all kind of other stimuli, including, for example, white noise. Recent optical imaging data from ferret AI did not support the notion about a topographically organized map of systematically varying sensitivity to stimulus pitch (Nelken et al., 2008
). On the other hand, in AI of the Mongolian gerbil, optical imaging studies were reported that revealed periodicity maps as an almost circular gradient superimposed on the linear tonotopic gradient in the low frequency part of AI (Schulze et al., 2002
). Psychophysically, periodicity pitch and frequency have been shown to be orthogonally organized (Plomp and Steeneken, 1971
). In the visual cortex different stimulus parameters have been shown to be represented in an orthogonal fashion (Hübener et al., 1997
; Kim et al., 1999
). From a theoretical point of view, it has been proposed that orthogonal maps are particularly suited for two-dimensional representation of multi-dimensional sensory inputs (Swindale, 2004
; Watkins et al., 2009
).
We therefore used the optical imaging technique to record with high spatial resolution activity patterns in cat primary auditory cortical field AI. For evoking cortical activity pattern our stimuli were chosen to elicit strong pitch sensations and to enable, as much as possible, independent variation of parameters in the spectral and temporal domain. This approach allowed us to successfully visualize the mapping of both the frequency and periodicity information in the same individual.
General Animal Preparation
Cats (4–8 months) were anesthetized for surgery with 25 mg/kg Ketamine hydrochloride in combination with 1.5 mg/kg Xylazine. Treatment of all animals was within the National Institutes of Health Guide for Care and Use of Laboratory Animals (Revised 1987). All experiments were approved by the German Animal Care and Use Committee. For optical imaging of the primary AI, a craniotomy was performed over the lateral cortex between Horsley-Clarke coordinates A10 and A20 and L10 and L15 to expose a region ranging from the suprasylvian sulcus over the dorsal parts of the anterior and posterior ectosylvian sulci. A stainless steel chamber was cemented onto the skull, the dura was removed and the chamber was filled with silicone oil and sealed with a cover glass. All pressure points and wound margins were infiltrated with a local anesthetic (Xylocain). During the experiments, the animals were continuously infused with 3–9 mg/h of pentobarbital (Nembutal) together with dextrose and electrolytes. Pentobarbital is a widely used anesthetic in experiments investigating cat auditory cortical electrophysiological properties (Schreiner et al., 1992
; Nelken et al., 1994
; Dinse et al., 1997
; Volkov and Galazyuk, 1998
; Cheung et al., 2001
; Raggio and Schreiner, 2003
). Thus, our results are comparable to other and own previous studies. The body temperature was kept at 37.5–38° and the ECG was monitored. Respiration was adjusted for an end-tidal CO2 between 3.5 and 4.0 %.
Auditory Stimuli
Acoustic stimuli were pure tones, harmonic sounds, and sinusoidal amplitude modulations. Examples of their spectra and waveforms are schematically illustrated in Figure 1
. Pure tone frequencies were 0.8, 1.6, 3.2, 6.4, and 12.8 kHz. Harmonic sounds were composed of harmonics of fundamental frequencies of 25, 50, 100, 200, 400, 800, and 1200 Hz. All harmonic sounds had an upper cut-off frequency of 4.8 kHz. In this way pitch information was concentrated in the spectral range which is most important for temporal periodicity processing (below 5 kHz). Moreover, the selected stimulus parameters allowed for a comparison with a MEG-study of the periodicity map in the human cortex (Langner et al., 1997
). For the same reason the lower cut-off frequencies were at 0.4, 0.8, or 1.6 kHz. The variation of the lower cut-off frequency resulted in spectrally different stimuli types which activate at least partly different spectral domains of the auditory system and therefore have a quite different timbre. This particular variation of stimulus types is especially relevant, because it is a well-known fact that the lowest harmonics of broad band sounds, which characterize the different stimulus types, dominate the processing of periodicity pitch (Ritsma, 1967
). Sinusoidal amplitude modulations had carrier frequencies of 0.8, 1.6, and 3.2 kHz and were modulated by 50, 100, 200, 400, or 800 Hz provided the ratio of carrier and modulation frequency was greater than three. All stimuli had durations of 200 ms, including linear rise and fall times of 10 ms, and were presented with interstimulus intervals of 1.6 s. Sound files with representative examples of different spectra and waveforms can be downloaded from the online supplementary material.
Sounds were digitally produced (sample rate 22 kHz) and presented via a digital sampler (Akai professional S2000). They were delivered by way of an electrostatic loudspeaker (‘headspeaker’ STAX Lambda pro) in a sound-proof room. The speaker was placed close to the ear (about 2 cm) contralateral to the recorded cortex. Stimuli were monitored acoustically and optically via an electrostatic microphone (B&K Type 4133, close to the animal’s ear) and a measuring amplifier (B&K Type 2609). The transmission curve was flat within 10 dB in the frequency range of the delivered stimuli between 0.4 and 12.8 kHz. The sound pressure level was varied between 0 and 50 dB SPL in steps of 10 dB, but mostly kept at 30 or 40 dB SPL, with possible auditory distortion products at least 20 dB below hearing threshold. The reason was to study cat cortical response at low to intermediate sound levels that are ecologically appropriate. More importantly, only at such low intensities it can be excluded that non-linearities result in difference signals in the hearing system which are similar to the fundamental frequency of the harmonic sounds. Non-linearities may also lead to distortion of maps and could contribute to change gradients from linear to more curvilinear ones.
Optical Recording
For optical measurements, we used a Lightstar II imaging and acquisition system (LaVision) with a 2 MHz A/D converter and a Peltier cooled, slow scan 12 bit digital CCD-camera controlled by a PC. Frame dimensions were 276 × 384 pixels covering 5.7 × 8.0 mm of the cortical surface resulting in a pixel resolution of 20.8 μm. Acquisition and averaging procedure was the same as described in details previously (Godde et al., 1995
; Dinse et al., 1997
). The cortex was illuminated with a 546 nm light source. After capturing the surface vessel pattern for spatial and anatomical reference, the camera was focused 500 μm below the cortical surface. Images were continuously obtained with acquisition times of 80 ms duration. We used a 2-fold averaging scheme (cf. Dinse et al., 1997
). During each single trial, 10 consecutive images of 80 ms duration each were accumulated and the resulting frames of 800 ms duration were then further averaged over six trials. Each trial was separated by a pause of 20–40 s. Non-stimulus control (blank) images were recorded prior to each trial presentation and averaged the same way as described for the stimulus images. This procedure resulted in a sequence of averaged frames of 800 ms each, providing information about the whole time course of the intrinsic signal from 800 ms before stimulus onset up to reaching baseline level again after the stimulus.
Computation of Maps
All images were computed by dividing a stimulus condition by a non-stimulus condition (‘single condition map’, SCM) and low-pass filtered using median filter (Kernel width 7 pixels, ∼200 μm). Each map consisted of a sequence of 10 images of 800 ms duration providing information about the time course of the signals. For further analysis, the frame containing maximal reflectance change within this time course series (i.e. the frame covering the activation peak), usually occurring during 2 and 3 s after stimulus onset, was used for further analysis. In addition, activation outliers or artefacts are eliminated by low-pass filtering. In total, 234 SCMs for pure tones and 149 SCMs for harmonic sounds were recorded in five animals.
The spatial distribution of reflectance changes was color coded. To visualize the spatial layout of frequency and pitch representations, so-called composite maps were computed using the single condition maps obtained for a number of pure tone frequencies. The procedure was comparable to the calculation of functional orientation maps in visual cortex. For each pixel its preferred frequency was determined as the average of all frequencies eliciting at least 50% of the maximum reflectance change (50% amplitude criterion), and coded with colors ranging from blue (low frequencies) over green and yellow to red (high frequencies). In the same way maps of preferred periodicity for each pixel were calculated and color coded. Data analysis was performed on Sun workstations and PC using custom made analysis software written in IDL™.
Statistical Analysis
The single condition maps were quantified using a two-dimensional coordinate system with a resolution of 276 points along the dorso-ventral and 384 points along the rostro-caudal axis. In this coordinate system the center of gravity, as the average of positions weighted by mass of each response map obtained for single stimulus conditions, was computed using custom made analysis software written in IDL™. Before computing average measures it is always crucial to exclude outlier and extreme values. Therefore, under the assumption of Gaussian distributions single condition maps with significant extreme values of their center of gravity were eliminated (7% of pure tone and 19% of harmonic sound responses; Nalimov-test, P = 95%; cf. Gumbel et al., 1953
). Multiple regression analysis was used to analyze direction, size, and significance of tonotopic and periodotopic gradients, which were defined as the direction of the maximal gradient (Table 1
, column 1). The relevant parameters of this analysis (P < 0.001) are given in Table 1
. The results of this analysis were used to average over all animals by means of circular statistics (Gumbel et al., 1953
; Table 1
, row 9). For that purpose vectors were added, which were given by the direction and the size of the gradients in individual animals.
Single Conditions Maps
Response maps for single stimulus conditions (see Figure 2
) for 5 different frequencies between 0.8 and 12.8 kHz, confirmed the well-known cochleotopic (tonotopic) organization of AI as the main activity areas shifted systematically when the stimulus frequency was changed (Figure 2
A). In accordance with previous optical imaging studies in AI (Bakin et al., 1996
; Hess and Scheich, 1996
; Dinse et al., 1997
; Harrison et al., 1998
; Spitzer et al., 2001
; Tsytsarev and Tanaka, 2002
; Versnel et al., 2002
; Nelken et al., 2004
; Ojima et al., 2005
), we found fairly large areas of reflectance changes, with an often patch-like appearance, specifically in the center of the frequency bands. The frequency-specific shift of response patterns along the rostro-caudal axis confirms the well-known tonotopic gradient as revealed in electrophysiological experiments (Merzenich et al., 1975
; Imig and Reale, 1980
).
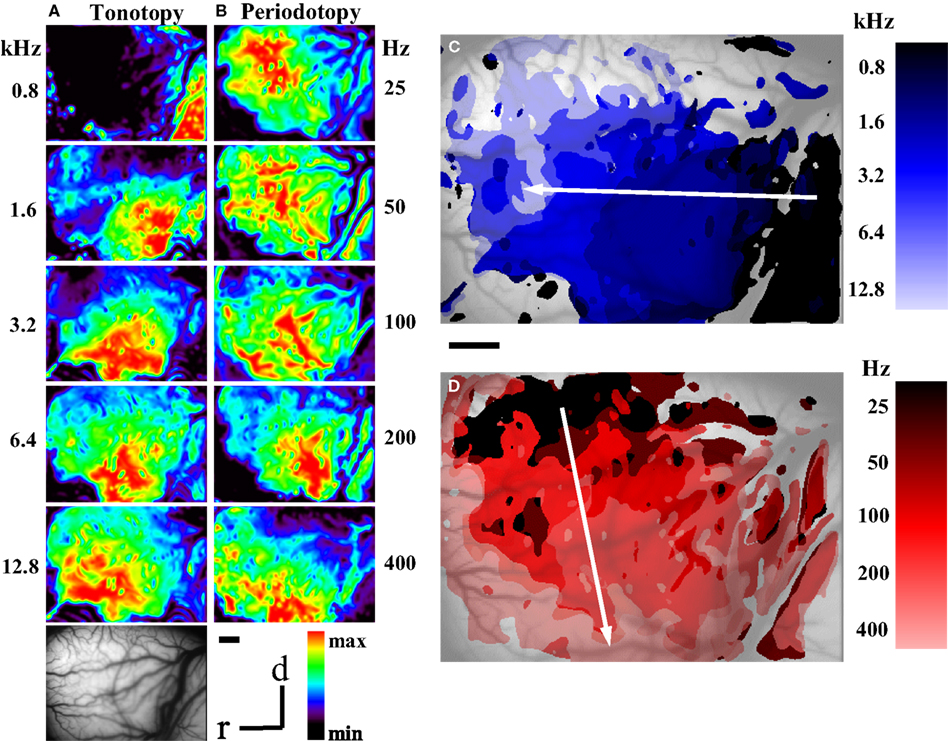
Figure 2. Optical imaging of intrinsic signals in cat auditory cortex after stimulation with pure tones and harmonic sounds. (A) Single condition maps for stimulation with pure tone bursts of 0.8 to 12.8 kHz as indicated. Sound intensity was 40 dB SPL. Bar length is 1 mm. Warm colors show regions of reflectance changes, indicating enhanced cortical activation. Each single condition map was individually scaled to its maximal reflectance change. The full color scale corresponds to fractional reflectance changes of maximal 4.9 × 10⁻². There is a shift of the areas of reflectance changes from caudal to rostral when the frequency of stimulation is increased, indicating the tonotopic or cochleotopic gradient. (B) Single condition maps for stimulation with harmonic sounds with harmonics covering the frequency range from 0.4 to 4.8 kHz and different fundamental frequencies between 25 and 400 Hz, as indicated. In order to have a constant bandwidth the lowest component of these stimuli were kept at 400 Hz and higher fundamentals were excluded. Same animal as in Figure 2
A. Sound intensity was 40 dB SPL. Conventions as in (A). Compared to pure tone responses, harmonic sounds activated larger areas that are less homogeneous than those recorded for pure tones. In contrast to the rostro-caudal shift for variation of frequency, systematic variation of fundamental frequencies from low to high revealed a shift of the activated areas from dorsal to ventral. (C) Frequency composite map calculated from the single condition maps shown in (A). For each pixel comprising the optical map, the frequency preference between 0.8 and 12.8 kHz is color coded according to the color bar shown on the right. The frequency map demonstrates a smooth and highly ordered representation of frequencies in AI confirming the tonotopic gradient running along the rostro-caudal axis. (D) Periodicity composite map calculated from the single condition maps shown in (B). For each pixel comprising the optical map, the periodicity preference between 25 and 400 Hz is color coded according to the color bar shown on the right. The periodicity map corroborates that periodicity is systematically mapped in AI along a ventro-dorsal gradient orthogonal to the gradient of the frequency representation in AI.
In Figure 2
B single condition maps in the same animal are shown for harmonic sounds with frequency components extending from 0.4 kHz to an upper cut-off frequency at 4.8 kHz and five different fundamental frequencies between 25 Hz and 400 Hz (for schematic illustrations of stimuli see Figure 1 and Supporting Information for sound files). As a rule the response areas obtained for broadband harmonic sounds were larger than those obtained with pure tones. In accordance with their identical spectral range, the response areas covered nearly the same extent (4.5 mm) of the rostro-caudal axis, but when the fundamental frequency was increased we observed systematic shifts of the response areas from dorsal to ventral, approximately orthogonal to the tonotopic gradient.
Composite Maps for Tonotopy and Periodotopy
In order to study the complete layout of both the tonotopic and the periodotopic organization, as well as their mutual interrelationship, we used the single condition maps to calculate composite maps for frequency and periodicity (Figures 2
C,D). The color code from dark to light blue indicates increasing stimulus frequency and marks for each pixel those stimulus conditions that evoked maximal responses. When the frequency of the pure tones was varied between 0.8 and 12.8 kHz the roughly dorso-ventrally orientated isofrequency bands of the tonotopic map shifted from rostral to caudal. The distance between frequency domains showed an average octave separation of about 1.07 mm (compare Table 1
, column 4), which is in line with the frequency gradient of 1–2 mm/octave reported for electrophysiological mapping experiments (Imig and Reale 1980
; Merzenich et al.,1975
; ). Interestingly, an overrepresentation of frequencies within a mid-frequency range above 5 and below 20 kHz has also been reported by Imaizumi and Schreiner (2007)
using electrophysiological methods. A similar finding has been reported for rats for the frequency range between 4 and 8 kHz (Kilgard and Merzenich, 1998
). Figure 2
D shows the periodicity map for the same animal, calculated for harmonic sounds with the same spectral range between 0.4 and 4.8 kHz. Fundamental frequencies were varied between 25 Hz (dark red) and 400 Hz (light red). The isoperiodicity bands were clearly tilted against the orientation of the isofrequency bands. In this periodicity map, low fundamental frequencies (25 Hz) were represented dorsally and higher fundamental frequencies (up to 1200 Hz) more ventrally, revealing an overall dorso-ventral periodicity gradient roughly orthogonal to the frequency gradient.
Relation Between Tonotopic and Periodotopic Maps
To analyze the interrelation between frequency and pitch maps, we averaged the locations of the response centers for all single stimulus conditions for pure tone stimulation and for harmonic sounds in each animal separately and then used these values to compute the average locations of the response centers for all animals combined (Figure 3
A). As expected from the composite maps of the individual animals (Figure 2
) the resulting centers shifted for pure tones (0.8–12.8 kHz) from rostral to caudal and for harmonic sounds (25–1200 Hz) approximately from dorsal to ventral.
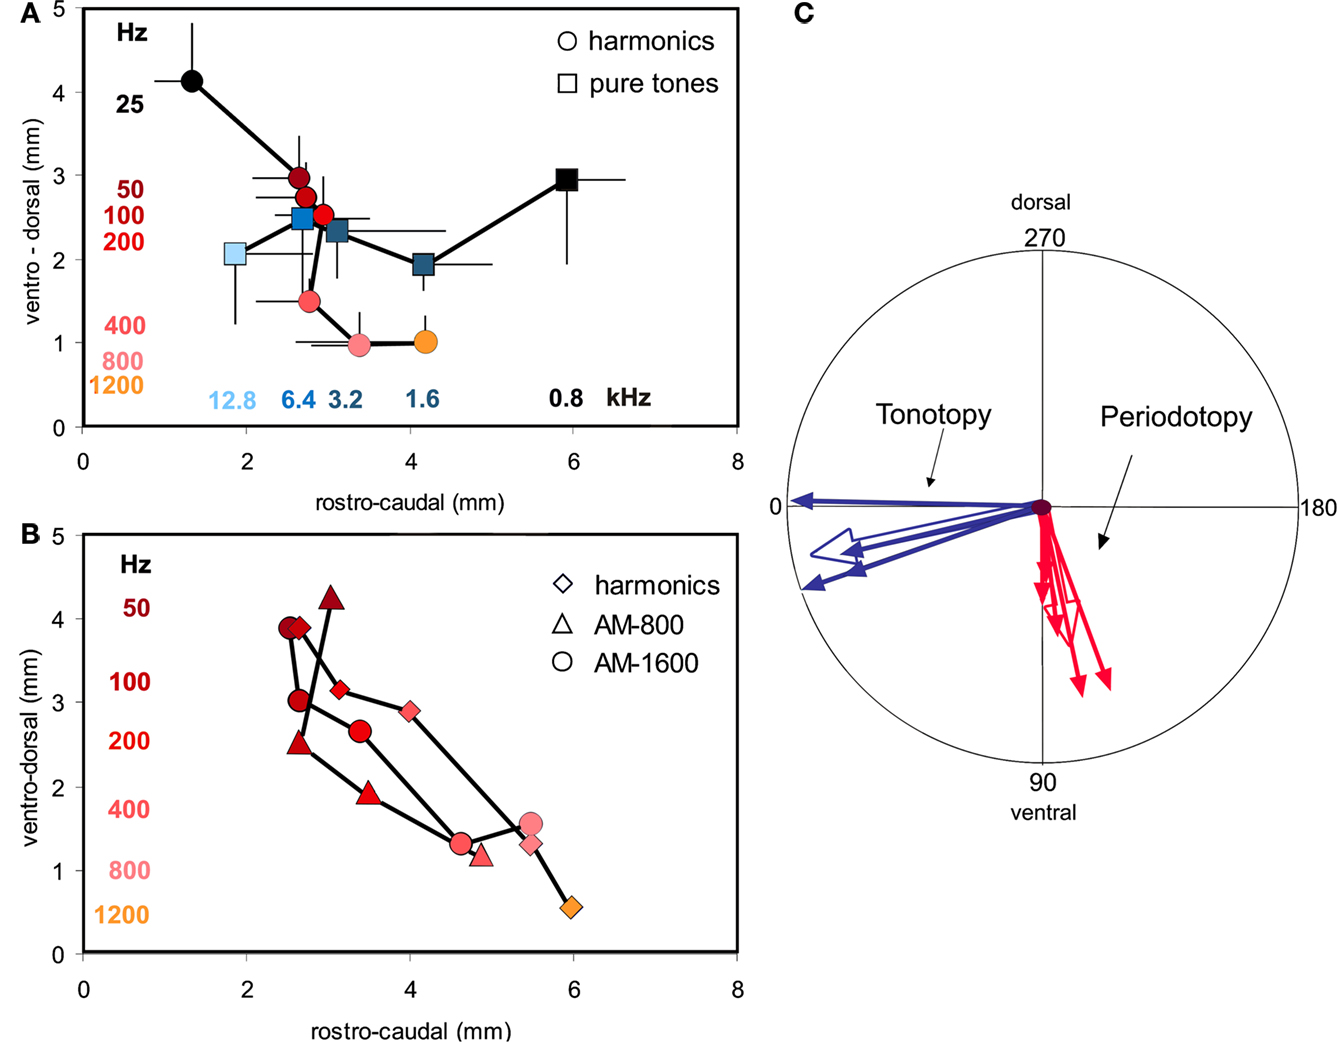
Figure 3. (A) Location of average response centers for harmonic sounds and pure tones indicating tonotopic (4 animals, n = 121 single condition maps) and periodotopic gradients (5 animals, n = 218 response maps), respectively. Stimulus conditions: signal intensity: 30 dB SPL; pure tones: 0.8–12.8 kHz, as indicated along the horizontal axis (black to light blue); harmonic sounds: 25–1200 Hz, as indicated along the vertical axis (dark violet to yellow). The spectrum ranged from 0.4 (for 25–400 Hz), 0.8 (for 800Hz) and 1.6 kHz (for 1200 Hz) to 4.8 kHz (for all sounds)., For clarity bars indicating standard deviations for the rostro-caudal and the ventro-dorsal direction are plotted for one side only. (B) Location of the centers of gravity of responses to different types of stimuli: harmonic sounds extending from 1.2 to 4.8 kHz with fundamental frequencies between 100 and 1200 Hz and 2 series of amplitude modulations (AM) with carrier frequencies of 800 Hz and 1600 Hz and modulation frequencies increasing from 25 to 400 Hz and 800 Hz, respectively. In spite of the different spectral compositions of these stimuli corresponding fundamental or modulation frequencies are mapped in close register as indicated by the color code (same colors as for harmonic sounds in Figure 3
A). (C) Results of a multiple regression analysis in each individual animal. The blue arrows indicate the direction of gradients of tonotopy and the red arrows the direction of gradients of periodotopy measured in individual animals (thin lines). The empty arrows indicate the direction of the corresponding gradients averaged over all animals. The radius of the circle indicates a gradient of 1.22 mm/octave.
Extent and orientation of these shifts were computed for each individual animal by using a multiple linear regression analysis. We found significant values for the slopes describing topographic gradients (P < 0.001, correlation coefficients: Table 1
, column 7), which are shown as a circular plot (Figure 3
C). The vector lengths indicate the size of the gradients in mm per octaves and were normalized to the maximal tonotopic gradient (Table 1
, column 4). This analysis confirmed that the periodotopic and tonotopic gradients are oriented in different directions which are roughly orthogonal to each other. While the angles for the tonotopic gradients in individual animals varied between 2° and −19°, those for the periodotopic gradients varied between −94° and −109° (Table 1
, column 1) resulting in angle differences between 77° and 96° (Table 1
, column 3). The dispersions of the directions were obtained from the standard errors of the linear regression analysis (Table 1
, column 2). When expressed in mm per octave the absolute size of the gradients varied between 0.35 and 0.94 for the periodotopy and 0.94 and 1.22 for the tonotopy (Table 1
, column 4).
In order to average over all animals, the results of the regression analysis were combined by means of circular statistics (Table 1
, row 9). The resulting mean gradients were orientated to −100°° ± 10° for the periodotopic (red arrow in Figure 3
C) and −12° ± 18° for the tonotopic gradient (green arrow), with a mean angle difference of 88°. The size of the averaged gradients (Table 1
, column 4) was 0.65 ± 0.08 mm/octave for periodotopy and 1.07 ± 0.16 mm/ octave for tonotopy. The latter difference indicates that more cortical territory, on average by a factor of 1.66, is devoted to the representation of an octave along the tonotopic than along the periodotopic gradient.
In one animal we compared periodicity obtained by using harmonic sounds and amplitude modulated sinusoidal carrier frequencies (AM) of 800 and 1600 Hz (Figure 3
B). In spite of the different stimulus types, the average response centers shifted approximately from dorsal to ventral with increasing fundamental-, envelope- or modulation-frequency. Obviously, signals with completely different spectra but the same pitch elicited responses which were in close proximity within the cortical map. This finding is a strong argument that the underlying pitch map is largely invariant against different stimulus conditions (for average magnitude and direction of the AM-shifts see Table 1
, row 10). Variation of sound intensity resulted in response shifts approximately parallel to the tonotopic gradient (Table 1
, row 11). Accordingly, it is unlikely that possible minor intensity changes in the sound transmission from the speaker to the tympanic membrane may explain the shifts of responses obtained with periodicity variations, because these shifts are orientated orthogonal and not parallel to the tonotopic gradient.
We used optical imaging of intrinsic signals to visualize the spatial relationship of both the frequency and pitch maps in cat primary AI (cf. Grinvald et al., 1986
; Vanzetta and Grinvald, 1999
, 2008
; Logothetis et al., 2001
). It has been previously demonstrated by microelectrode mapping procedures that there exists a close match between the spatial distributions of reflectance changes of intrinsic optical signals with a map of local field potentials measured in the same animal (Godde et al., 1995
). Together these data indicate that the broad spatial activations typically seen in optical imaging data do not reflect methodological constraints but rather the pattern of subthreshold and spiking activation (Narayan et al., 1994
), and thus a true property of cortical representations.
The different sources of intrinsic signals can be separated and selected by choosing appropriate wavelength of illumination of the cortical surface. Changes of blood volume due to local capillary recruitment are observed at blue-green light (around 540 nm). In contrast, changes of oxygen saturation of haemoglobin reflecting the haemoglobin-oxyhaemoglobin ratio can be recorded at orange to red illumination, most often achieved with wavelength between 600 and 700 nm although maximal signals have been reported to occur at 605 nm (Bonhoeffer and Grinvald, 1996
; Hess et al., 2000
). Studies in the visual cortex revealed that largest signal amplitudes can be obtained with green light (Frostig, 1998
), on the other hand, blood vessel artifacts become smaller at longer wavelength. Hess and coworkers compared optical imaging maps obtained in Gerbil whisker cortex with 577 and 605 nm (Hess et al., 2000
). While the activity maps obtained with green light where much broader than those found with red light, their focus of activation was almost identical. For reasons that remain largely elusive, it is much more difficult to generate maps in AI using red light compared to visual cortex. In fact, most of the available studies applying optical recording of intrinsic signals in AI used green light, and by that recorded blood volume changes (Dinse et al., 1997
; Harel et al., 2000
; Spitzer et al., 2001
; Tsytsarev and Tanaka, 2002
; Nelken et al., 2008
).
The spatial resolution that limits intrinsic signal imaging depends to a great extend on the density and fine-structure of the underlying capillary system. Preparing capillary networks by corrosion cast methods it has been shown that intrinsic signals associated with AI activation correlate with discrete capillary beds. These capillary beds, within the cortical surface layers, are distributed across the cortex in a non-uniform fashion (Harrison et al., 2002
). This study also provided evidence for the existence of small-scaled (<10 micron) flow control structures for both the arterial supply and the capillary network. Spitzer et al. (2001)
argued that the success of optical imaging in visual and barrel cortex depends on specializations of the vascular supply that are coupled to the underlying anatomic-morphologic modular organization and may be absent or different in cat AI. Possible reasons for differences between VI and AI remain unclear but it might be speculated that spontaneous optical signals based on slow oscillations of local cerebral and somatic blood flow (Mayhew et al., 1996
) induce much more noise in auditory than visual cortex as a result of the underlying vasculature.
When attempting to relate electrophysiological recordings from single cells to OI data one has to keep in mind that OI is only weakly related to action potentials (as is the case in extracellular neuron recordings), but mainly records subthreshold synaptic activity in a graded and activity dependent matter (Logothetis et al., 2001
). Based on high-resolution maps obtained with Fourier imaging in AI, Kalatsky et al. (2005)
reported that the strength between the optical response and the spiking bandwidth at the intensity of stimulation for optical imaging was not correlated suggesting that the optical signal in AI is evoked not only by spiking activity but also by other metabolic dependent activities such as subthreshold membrane phenomena.
Complex systems of overlaid functional maps have been described for bat primary AI by means of electrophysiological mapping (Suga and O’Neill, 1979
), and for the visual (Hubener et al., 1997
; Kim et al., 1999
; Swindale, 2000
), and more recently also for the somatosensory cortex (Friedman et al., 2004
) by means of optical imaging. The present findings in primary AI support the concept that such systems might represent a typical feature of cortical processing.
It is well-documented from electrophysiological mapping experiments that frequency-maps in cat AI display a complex spatial arrangement of responsiveness along the axis orthogonal to the cochleotopic frequency gradient. Evidence has been provided for representations of functional parameters such as spectral resolution (sharpness of tuning), temporal resolution (preferred repetition rate), sound intensity and inhibitory properties related to the coding of broadband signals (Schreiner and Mendelson, 1990
; Schreiner, 1991
). Furthermore, the existence of so-called multi-peaked tuning curves adds to a patchy, irregular pattern of activation (Sutter and Schreiner, 1991
). Finally, it can not be ruled out that the vascular patterning might influence the layout of the activity distributions. On the other hand, in previous experiments we have shown that activity patterns obtained with green light are in very good accordance with the underlying local field potential distribution (Dinse et al., 1997
). As shown in Table 1
, the frequency gradient of 0.8–1.2 Octaves/mm (6–9 kHz CF) is well in accordance with previous electrophysiological data (Imaizumi and Schreiner, 2007
).
Broad overlapping cortical activation pattern are a rather straightforward and inescapable consequence of the observation that a huge number of broadly tuned neurons is activated, after even the most simplest form of sensory stimulation. This mass activity includes both spiking and suprathreshold activity. Recently, we have observed large overlap by using intrinsic optical imaging in somatosensory cortex (Godde et al., 1995
), which has been hypothesized to represent a general principle of overlapping networks in functionally related cortical areas for distributed processing.
While frequency information is extracted by mechanical filtering of the cochlea, periodicity information is analyzed by temporal filter mechanisms in the brainstem (Schreiner and Langner, 1988
; Frisina et al., 1990
; Langner, 1992
; Heil et al., 1995
; Krishna and Semple, 2000
; Langner et al., 2002
; Rees and Langner, 2005
). In the inferior colliculus of different mammals, including the cat, the tonotopic gradient for increasing sound frequency is oriented roughly from dorsal to ventral while the periodotopic gradient for increasing periodicity frequency is oriented roughly from medial to lateral (Schreiner and Langner, 1988
; Langner, 1992
; Heil et al., 1995
; Langner et al., 2002
). Previous evidence for the existence of periodicity maps in the AI comes from various techniques such as electrophysiological recordings (Schulze and Langner, 1997
), optical imaging (Schulze et al., 2002
), and 2-deoxyglucose-labelling (Langner, 2005
) in gerbils and magnetoencephalography in humans (Pantev et al., 1989
; Langner et al., 1997
). However, the conclusions about the spatial relationship between tonotopic and periodotopic maps are partly contradictory, reaching from a parallel (Pantev et al., 1989
; Nelken et al., 2008
) to orthogonal arrangements (Langner et al., 1997
; Schulze and Langner, 1997
; Langner, 2005
). Here we show new data regarding the spatial representation of periodicity information in cat AI in relation to the frequency representation.
Our optical recordings of intrinsic signals demonstrate that cat AI contains two overlaid functional maps resulting from the processing of spectral and temporal acoustic information. The basic map is the tonotopic map, a highly ordered representation of sound frequency (Merzenich et al., 1975
; Imig and Reale, 1980
; Spitzer et al., 2001
; Versnel et al., 2002
; Nelken et al., 2004
; Ojima et al., 2005
), which is overlaid by a periodotopic map, a ‘computational’ map for envelope periodicity. In contradiction to optical imaging data obtained in ferrets (Nelken et al., 2008
), revealing a progression of period sensitivity parallel to the tonotopic gradient, in our cat data, periodicity is mapped along an axis approximately orthogonal to frequency. Acoustic signals have always combined spectral and temporal aspects which, nevertheless, may be processed differently in the brain. By a careful selection of stimuli, we tried to separate the mapping of spectral and temporal information. For example, a pitch shift due to a variation of the fundamental frequency of an unfiltered harmonic sound would result in corresponding shifts of the cortical responses parallel to the tonotopic axis. We avoided the possible misinterpretation that pitch is mapped parallel to the tonotopic axis by constant lower and upper cut-off frequencies of the harmonic signal, keeping the tonotopic location of the response constant. Since these harmonic complexes had constant bandwidths and constant spectral densities, differences in the bandwidth of tuning along the dorso-ventral axis (Schreiner and Sutter 1992
) cannot account for periodotopic shifts along the same axis. Although AM signals have a less salient periodicity pitch than harmonic sounds, they also allow to distinguish between the effects of temporal and spectral processing, because their pitch may be varied without much variation of the spectrum. For the establishment of periodicity maps the overall sound pressure level was kept at or below 40 dB SPL to avoid auditory distortion products. Although nobody knows the exact strength of distortion products in the auditory system of the cat, one may suspect that they could give rise to additional frequencies which may contribute to shifts of activity parallel to the tonotopic axis in the cortex. Although therefore such distortions could have some effect at higher intensities, they cannot explain the observed activity shifts orthogonal to the tonotopic axis. Similarily, our finding of pitch dependent shifts of activity orthogonal to the tonotopic axis may not be explained by the fact that with a constant level of band-limited harmonic sounds, the number of harmonics and within the level of the individual partials varies with pitch. As indicated in Table 1
, row 11 even changes of the overall level result in comparatively small activity shifts roughly parallel to the tonotopic axis. One may argue that the assumption of a Gaussian distribution of the center of gravity of responses may be wrong or inaccurate. Provided this is true, the position of the centers of gravity and within the resulting maps may be defective. Although such an error could give rise to distorted maps, it is quite unlikely that it could give rise to a systematic finding of orthogonal maps.
The cortical space devoted to the representation of one octave of periodicity information is on average only about 40% smaller than the space for a representation of an octave of frequency information. Nelken et al. (2008)
argued that periodotopic maps obtained with sinusoidally amplitude modulated tones were the results of combination tones. We compared harmonic sounds and amplitude modulated sinusoidal carrier frequencies and found that these signals in spite of their different spectra elicited the same periodotopic gradient orthogonally to the frequency map.
Our results support the concept that in addition to frequency, periodicity pitch is another major parameter of cortical auditory information processing. Indeed, there is evidence from single unit recordings in the inferior colliculus that periodicity information plays a major role for grouping of signal components separated by cochlear frequency analysis (Biebel and Langner, 2002
). Accordingly, processing of periodicity information might contribute to the enhancement of signal/noise ratios and to the sound segmentation which plays an important role for the so-called ‘cocktail-party’ effect (Darwin and Ciocca, 1992
; Bregman et al., 1999
; Brungart and Simpson, 2002
).
Generally, assuming a linear gradient for periodicity is the most straightforward and simple model. By the same token, we do not see a plausible argument or hypothesis supporting a circular arrangement. In fact, having a circular periodicity overlaid across a linear tonotopy, results in confounding periodicity and frequency, as the same periodicity will be associated at two different locations in the frequency map. Such a phenomenon would contradict theoretical expectations and psychophysical data which in our eyes is a strong argument against a circular gradient.
An orthogonal spatial relationship between tonotopic and periodotopic maps means that, in most cases, the frequencies of the preferred pure tone (centre frequency, CF) and the preferred fundamental of a neuron are different. However, at least some neurons in the low CF-region of the IC of chinchilla showed some sensitivity to the amplitude modulation of a high carrier-freqency, provided the modulation frequency was equal to their CF (Biebel and Langner, 2002
). In this experiment the stimulation paradigm was chosen to avoid harmonic distortion, which otherwise could offer an obvious alternative explanation (McAlpine 2004
). On the other hand, if the spatial relationship between tonotopic and periodotopic maps in AI are parallel as suggested by Pantev et al. (1989) and Nelken et al. (2008)
one should expect to find that many – if not all – neurons in AI respond to both pure tones and harmonic complex sounds with the same fundamental frequency, even when the fundamental is missing. This is not the case. However, such pitch-selective neurons were found in a region near the anterolateral border of the primary AI of marmoset monkeys (Bendor and Wang, 2005
) in accordance with the location of a pitch-selective area identified in imaging studies in humans (Patterson et al., 2002
; Penagos et al., 2004
).
Orthogonality of periodicity pitch and frequency was already found in psychophysical investigations (Plomp and Steeneken, 1971
): A multi-dimensional scaling analysis revealed perceptual distances per octaves of stimuli 1.63 times larger for variations of spectral centers than for variations of periodicity for human subjects. The authors suggested perceptual independence of timbre (frequency) and pitch (periodicity), which might be accomplished by a corresponding orthogonal representation in the auditory system. The mean ratio of gradients of tonotopy and periodotopy found in the present study (1.66) is nearly identical to the value obtained psychophysically in humans. The present results raise the question whether perceptual orthogonality may be always based on the orthogonality of corresponding brain maps.
The authors declare that the research was conducted in the absence of any commercial or financial relationships that could be construed as a potential conflict of interest.
The work was supported by the Institute for Neuroinformatics at the Ruhr-University Bochum, the DFG SFB 509 to Hubert R. Dinse, the DFG SFB 269 to Gerald Langner and The Volkswagen-Stiftung (I 73035) to Ben Godde. We are grateful to Dr. K. P. Hoffmann, Department of Biology and Neurobiology for providing a sound-proof room.
The Supplementary Material for this article can be found online at http://www.frontiersin.org/integrativeneuroscience/paper/10.3389/neuro.07/027.2009/