Computational modeling of distinct neocortical oscillations driven by cell-type selective optogenetic drive: separable resonant circuits controlled by low-threshold spiking and fast-spiking interneurons
- 1 McGovern Institute of Brain Research, Massachusetts Institute of Technology, Cambridge, MA, USA
- 2 Athinoula A. Martinos Center for Biomedical Imaging, Massachusetts General Hospital, Charlestown, MA, USA
- 3 Department of Neurobiology, Yale University School of Medicine, New Haven, CT, USA
Selective optogenetic drive of fast-spiking (FS) interneurons (INs) leads to enhanced local field potential (LFP) power across the traditional “gamma” frequency band (20–80 Hz; Cardin et al., 2009). In contrast, drive to regular-spiking (RS) pyramidal cells enhances power at lower frequencies, with a peak at 8 Hz. The first result is consistent with previous computational studies emphasizing the role of FS and the time constant of GABAA synaptic inhibition in gamma rhythmicity. However, the same theoretical models do not typically predict low-frequency LFP enhancement with RS drive. To develop hypotheses as to how the same network can support these contrasting behaviors, we constructed a biophysically principled network model of primary somatosensory neocortex containing FS, RS, and low-threshold spiking (LTS) INs. Cells were modeled with detailed cell anatomy and physiology, multiple dendritic compartments, and included active somatic and dendritic ionic currents. Consistent with prior studies, the model demonstrated gamma resonance during FS drive, dependent on the time constant of GABAA inhibition induced by synchronous FS activity. Lower-frequency enhancement during RS drive was replicated only on inclusion of an inhibitory LTS population, whose activation was critically dependent on RS synchrony and evoked longer-lasting inhibition. Our results predict that differential recruitment of FS and LTS inhibitory populations is essential to the observed cortical dynamics and may provide a means for amplifying the natural expression of distinct oscillations in normal cortical processing.
Introduction
Neocortical oscillations are believed by many to be essential to perception and memory, and several neurologic and psychiatric diseases are characterized by alterations in these patterns (Herrmann and Demiralp, 2005; Jensen et al., 2007; Tallon-Baudry, 2009). However, any given neocortical rhythm may alternatively be an epiphenomenon of neural information processing. Developing a mechanistic, cellular-level understanding of the origin of these rhythms is likely key to identifying what, if any, computational role they have, and to understanding the changes underlying their altered expression in disease.
Until recently it was not possible to selectively record and drive distinct cell populations in vivo, making it difficult to decisively identify the precise contributions of specific excitatory and inhibitory mechanisms to rhythm generation in fully embodied networks. Computational modeling and in vitro experimental work have provided a leading source of insight. Extensive work has supported the critical role of fast-spiking (FS) interneurons (INs) and the time constant of GABAA synaptic inhibition in controlling gamma rhythmicity (e.g., Whittington et al., 1995, 2000; Borgers and Kopell, 2005; Bartos et al., 2007; Mann and Paulsen, 2007). The role of oscillatory activity in pyramidal, regular-spiking (RS) excitatory neurons in gamma generation is more ambiguous. While the presence of sufficient glutamatergic activity to recruit IN activity is essential in most models and in vitro preparations, the decay rate of synaptic excitation is typically thought to be less important. In contrast, the origin of low-frequency cortical activity (e.g., 8 Hz – “alpha” band activity) has been tied to intrinsic biophysical properties of cortical pyramidal neurons (Silva et al., 1991; Castro-Alamancos and Connors, 1996; Jones et al., 2000), and to reciprocal thalamocortical loops (Contreras and Steriade, 1995; Hughes and Crunelli, 2005; Jones et al., 2009).
Optogenetic tools provide a novel avenue for investigating the cellular mechanisms controlling neocortical rhythmicity in vivo, by permitting selective drive of distinct neural populations. Using the light-sensitive cation channel Channelrhodopsin-2 (ChR2; Deisseroth et al., 2006) to drive either FS or RS in neocortex, we recently found that selective FS stimulation from 8 to 200 Hz led to increased local field potential (LFP) power above baseline at the driving frequency, specifically in the gamma band (most pronounced at 32–64 Hz) (Cardin et al., 2009). In contrast, selective RS activation showed a peak in enhanced power at 8 Hz, with significantly weaker higher frequency recruitment (Figure 1A).
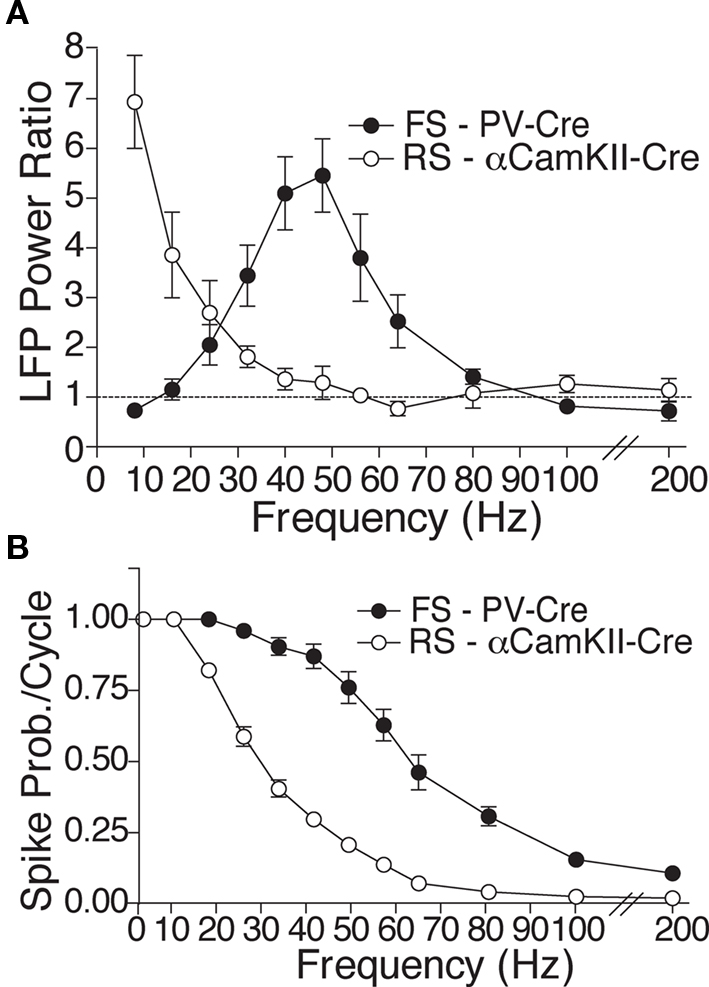
Figure 1. Experimental findings of contrasting resonance properties with RS and FS drive. (A) Mean power ratio in each frequency band in response to light activation of FS (filled circles; n = 14 sites in six PV-Cre mice) and RS (open circles; n = 13 sites in five CamKII-Cre mice) cells at those frequencies. (B) Average spike probability per light pulse cycle in light-activated FS and RS cells in the PV-Cre and CamKII-Cre mice, respectively (figures adapted from Cardin et al., 2009).
While these FS effects agree with previous findings, two distinct hypotheses could explain the response to RS stimulation. First, the intrinsic biophysics of RS cells that cause them to fire more slowly than FS in response to injected current (Fanselow et al., 2008) may reduce the ability of RS to respond to high frequency optogenetic drive, and this alone may be sufficient to generate low-frequency LFP enhancement (Tiesinga and Sejnowski, 2009). In support of this hypothesis, the observed action potential responses of RS cells driven by light were consistently less than those of FS cells at all frequencies of drive >10 Hz (Figure 1B).
A second, potentially compatible hypothesis is that RS drive selectively recruits a distinct network process that enhances lower-frequency oscillations. While this differential process could take many forms, an appealing candidate is selective recruitment of low-threshold spiking (LTS) INs. These inhibitory IN are distinct from FS IN in that they have greater numbers of contacts on distal rather than proximal dendrites of pyramidal neurons (Markram et al., 2004; Goldberg and Yuste, 2005), and can operate on slower time constants (Goldberg and Yuste, 2005), including displaying longer-lasting inhibition (Silberberg and Markram, 2007). Most important for the current study, these cells can be difficult to recruit in sensory neocortex, requiring synchronous pre-synaptic drive and/or higher frequency input from connected pyramidal neurons (Beierlein et al., 2003; Kapfer et al., 2007; Tan et al., 2008). Strong optogenetic activation directly to RS may have exceeded the threshold for driving LTS cells, leading to enhanced lower-frequency oscillations induced by the longer inhibition produced by LTS. In support of this hypothesis, in vitro studies in rodent sensory neocortex implicate LTS in low-frequency rhythmogenesis (Fanselow et al., 2008). A similar class of inhibitory cells, the oriens-lacunosum-moleculare cells in the hippocampus, has also been implicated in generating low-frequency theta oscillation (8–12 Hz) in hippocampus (Gloveli et al., 2005).
In this study, we developed a single, biophysically realistic neocortical model to test hypotheses that may shape the contrasting network responses observed experimentally for selective FS or RS drive. The model initially included only RS and FS neurons simulated with multiple dendritic compartments and active somatic and dendritic ionic currents appropriate to replicate cell anatomy and physiology described in whole cell in vitro recordings, and a realistic synaptic architecture across the network (Figure 2). As expected, this canonical FS–RS network reproduced the experimentally observed gamma enhancement with FS drive. However, inclusion of rich biophysical detail in the RS cells in this classic network was not sufficient to reproduce lower-frequency 8 Hz enhancement or the smoothly decreasing spike probability response during RS drive. In support of the alternative hypothesis, inclusion of LTS INs in the network, which required synchronous RS drive for activation, replicated the spike probability response and low-frequency enhancement observed experimentally for RS drive, while preserving gamma enhancement with FS drive. These findings indicate that differential engagement of distinct inhibitory networks may amplify the expression of distinct oscillations in normal cortical processing.
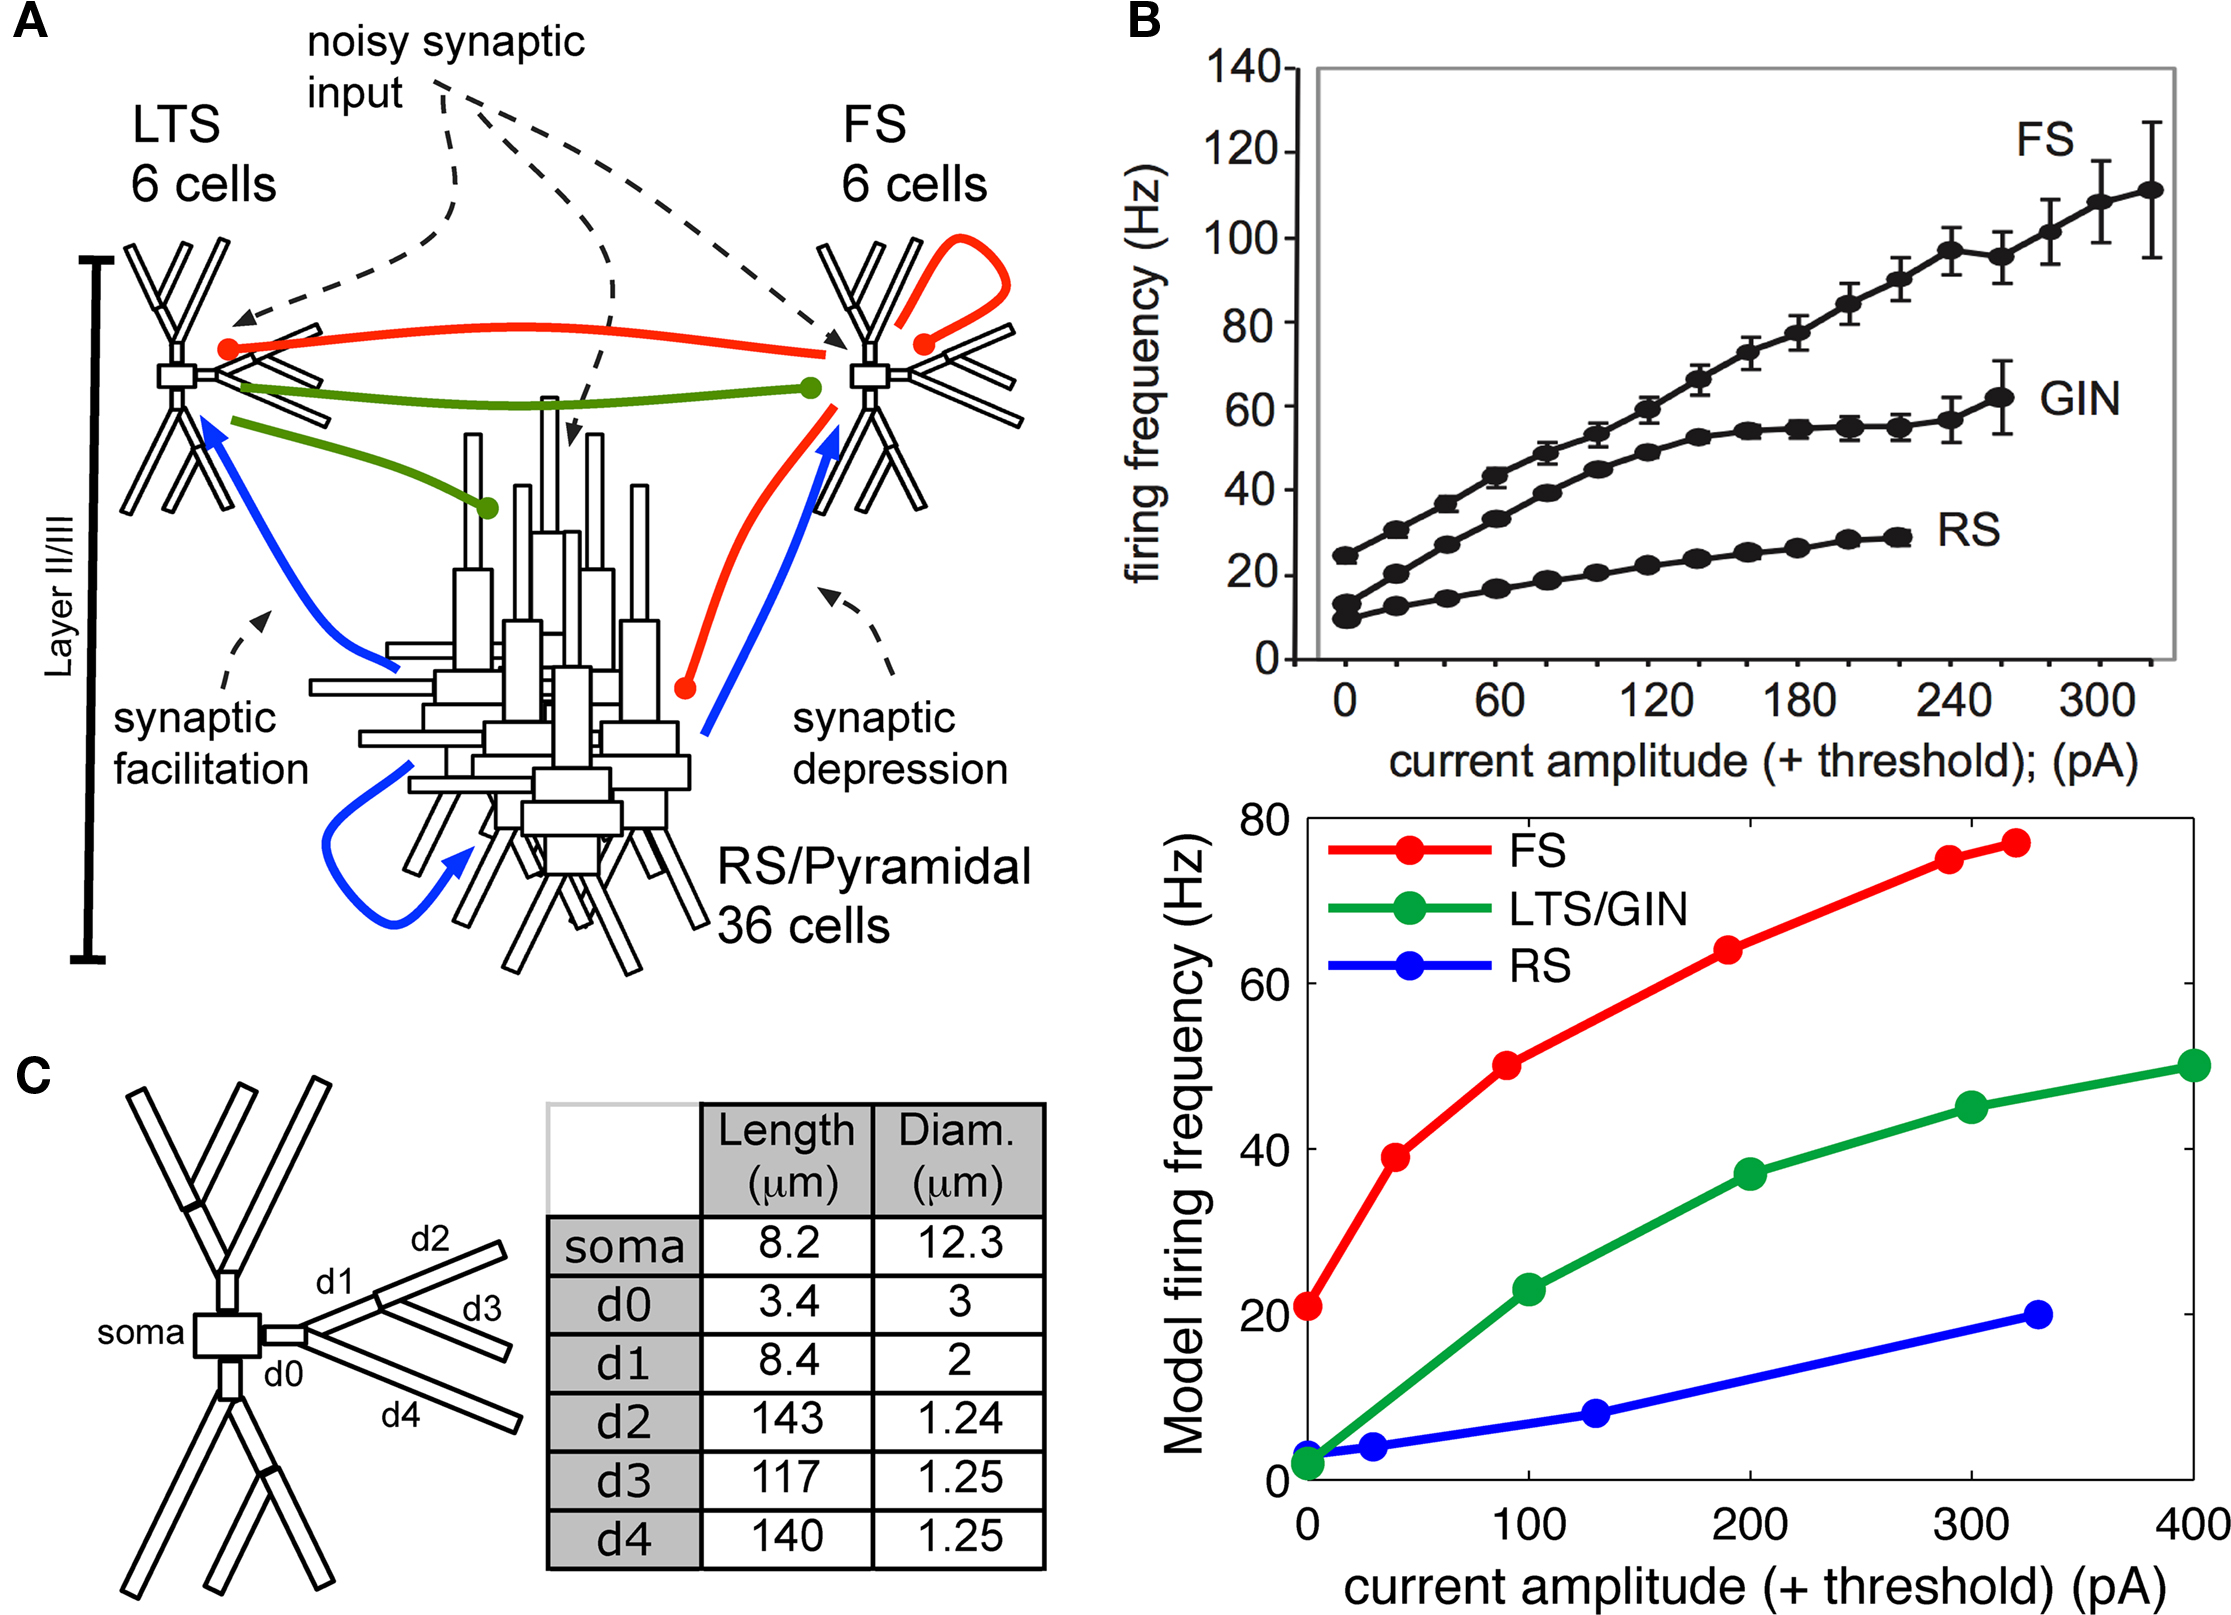
Figure 2. Model construction methods. (A) Schematic showing model network. Initial simulations contained only RS and FS cells and connections. (B) Top panel: Frequency response to injected current in individual cortical FS, RS, and the genetically marked GIN population of LTS cells in vitro (adapted from Fanselow et al., 2008). Bottom panel: Frequency response to injected current in modeled individual (out of network) FS, RS, and LTS cells, where LTS cells corresponded to the GIN population in (A). (C) Compartment dimensions for FS and LTS INs, with the exception that soma was larger in LTS (24.3 × 11 μm); measurements were identical for the three branching dendrites.
Materials and Methods
General Modeling Methods
We constructed a network model representative of cortical layer II/III containing three cell types: pyramidal RS cells, FS INs, and LTS INs. We restrict the model layer II/III because experimental tetrode recordings showed spiking primarily in supragranular layers (Cardin et al., 2009). Simulations were performed using the NEURON simulation environment with the implicit Euler integration method, dt = 0.025 and temperature set at 30°C. Upon publication, the model will be made available in the model DB database as with previous modeling by our group1.
Pyramidal Cell
Each modeled pyramidal cell contained eight compartments with morphology as in Bush and Sejnowski (1993), Jones et al. (2007, 2009), and Ziegler et al. (2010) (shown schematically Figure 2A) and contained INa, Ik, Im, ICa, IKCa, and ILeak currents in both soma and dendrites, with equations for all channel kinetics as in (Mainen and Sejnowski, 1996), code available in the model DB data base2. Maximal conductances and reversal potentials were tuned to generate cell properties reported in vitro, including adapting regular spike trains, slow periodic spiking at threshold, and spike rate and passive properties (Mason and Larkman, 1990; Beierlein et al., 2003; Tateno et al., 2004; Fanselow et al., 2008), see Table 1 for parameter values. Table 2 shows resting membrane potentials, input resistance, membrane time constant, spike thresholds to injected current, and corresponding spike frequency in response to injected current in Figure 2B, which were consistent with those reported experimentally in Fanselow et al. (2008).
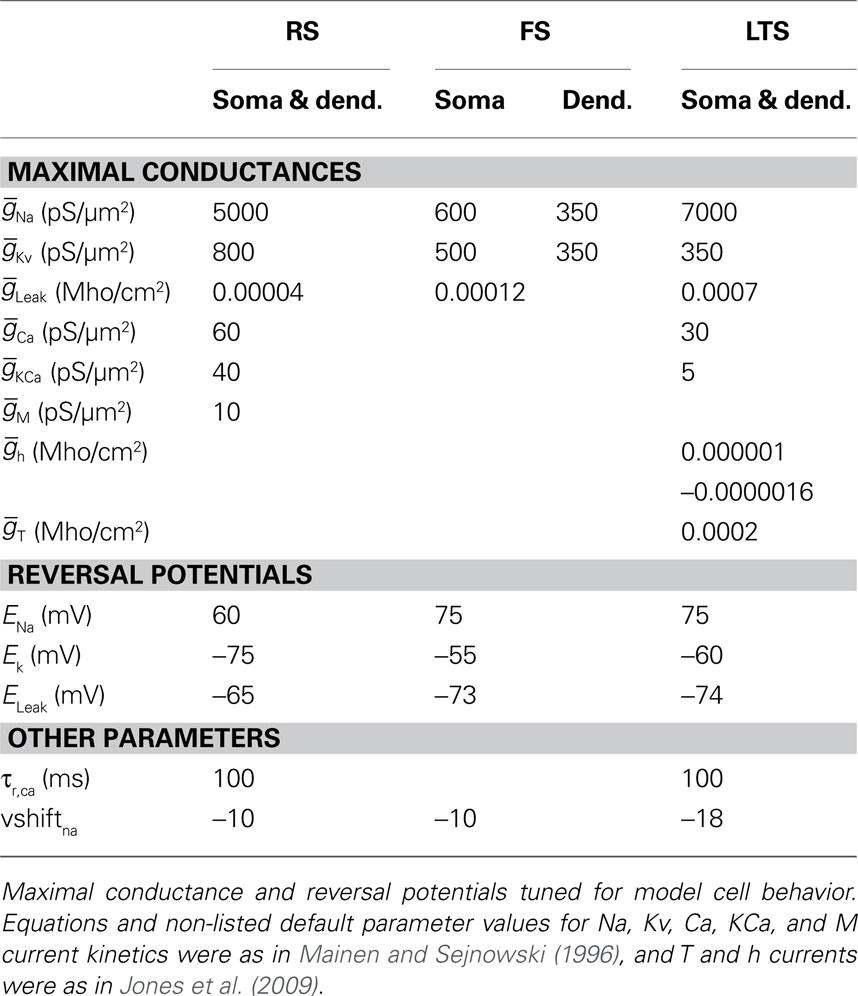
Table 1. Intrinsic parameters for three model cell types.
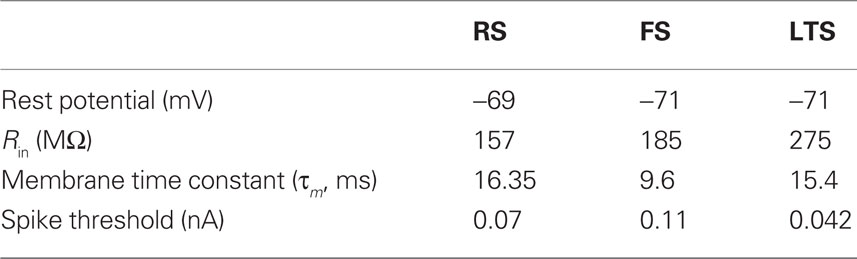
Table 2. Passive cell properties for three model cell types.
Fast-Spiking Interneuron
Fast-spiking interneurons contained 16 compartments, including three branching dendrites based on the somatic size and approximate branching range of the aspiny cell described in Mainen and Sejnowski (1996), dimensions given in Figure 2C. They contained only INa, Ik, and ILeak modeled as in the pyramidal cells, with maximal conductances as in Table 1, and generated spike rates and threshold values based on (Tateno et al., 2004; Fanselow et al., 2008) without adaptation. Passive properties (Table 2) were based on (Kawaguchi, 1995; Cauli et al., 1997; Beierlein et al., 2003; Tateno et al., 2004), and spike frequency responses were consistent with those reported experimentally (Figure 2B).
Low-Threshold Spiking Interneuron
The morphology of the LTS INs was the same as the FS INs (shown schematically in Figure 2C), with the exception that the soma was larger, consistent with somatostatin-positive GIN cells in Fanselow et al. (2008) (24.3 microns long by 11 microns in diameter), which correspond to LTS INs. Cells contained INa, Ik, ICa, IT, IKca, Ih, and ILeak currents. The IT and Ih currents were modeled as in Jones et al. (2009) with maximal conductance in the h currents increasing exponentially from the soma to the dendrite, while remaining channels were as in Mainen and Sejnowski (1996). Maximal conductances and reversal potentials were tuned to generate adaptation, slow periodic spiking at threshold, and the sag and depolarizing rebound that characterize LTS cells, as well as the passive properties, threshold, and spike frequency based on Cauli et al. (1997), Ma et al. (2006), and Fanselow et al. (2008) (see Tables 1 and 2; Figure 2B).
Network Architecture
The models contained 36 RS cells, and six of each FS and LTS IN subtype (Figure 2A), in agreements with estimates that approximately 20–30% of cortical neurons are INs and that about half of INs are FS (Ren et al., 1992; Markram et al., 2004). All cells were fixed in a square 6 × 6 square grid pattern, as in Jones et al. (2009).
Network connectivity was based on the rate of synaptically coupled FS, LTS, and RS cells in somatosensory cortex recorded in vitro (Beierlein et al., 2003; Gibson et al., 2005). Of all possible pair-wise connections, the experimentally based proportion of connections (see Table 3) was selected uniformly at random, and held constant through all simulations. The synaptic connections were modeled as α-functions that were turned on by the soma of the pre-synaptic cell crossing a voltage threshold (0 mV), as in Jones et al. (2007). Excitatory connections representing AMPA synapses, were modeled with a 0.1-ms rise and 3-ms decay rate time constant. Inhibitory connections from FS cells represented GABAA synapses were modeled with a 0.5-ms rise and 8-ms decay rate time constant (Salin and Prince, 1996; Whittington et al., 1995). Inhibitory synaptic connections from LTS cells were longer, with a decay rate time constant of 50 ms, consistent with reports that cortical LTS INs produce extended inhibition (Silberberg and Markram, 2007). Excitatory connections to both inhibitory populations were facilitating for LTS and depressing for FS based on Beierlein et al. (2003), Kapfer et al. (2007), Silberberg and Markram (2007), and Tan et al. (2008). Facilitation and depression were modeled as in Varela et al. (1997), and Garabedian et al. (2003) (facilitation parameters: f = 0.2, τf = 200 ms, depression parameters: f = 0.5, τf = 94 ms, d1 = 0.46,  , d2 = 0.975,
  ). Importantly, LTS cells projected to the two most distal compartments of the RS apical dendrite, whereas the FS cells projected to RS somata (Markram et al., 2004; Goldberg and Yuste, 2005), depicted schematically in Figure 2A. Projections between RS cells synapsed onto the three basal dendrite compartments, and all remaining connections were to the soma compartment of the post-synaptic cell. See Table 3 for maximal synaptic conductance values, which were equal for each targeted post-synaptic dendritic compartment. Synaptic weights were identical for all connections between specified populations. All synaptic delays were 1 ms, with the exception of the RS to RS connections that had delays between 1 and 6 ms depending on distance between cells.
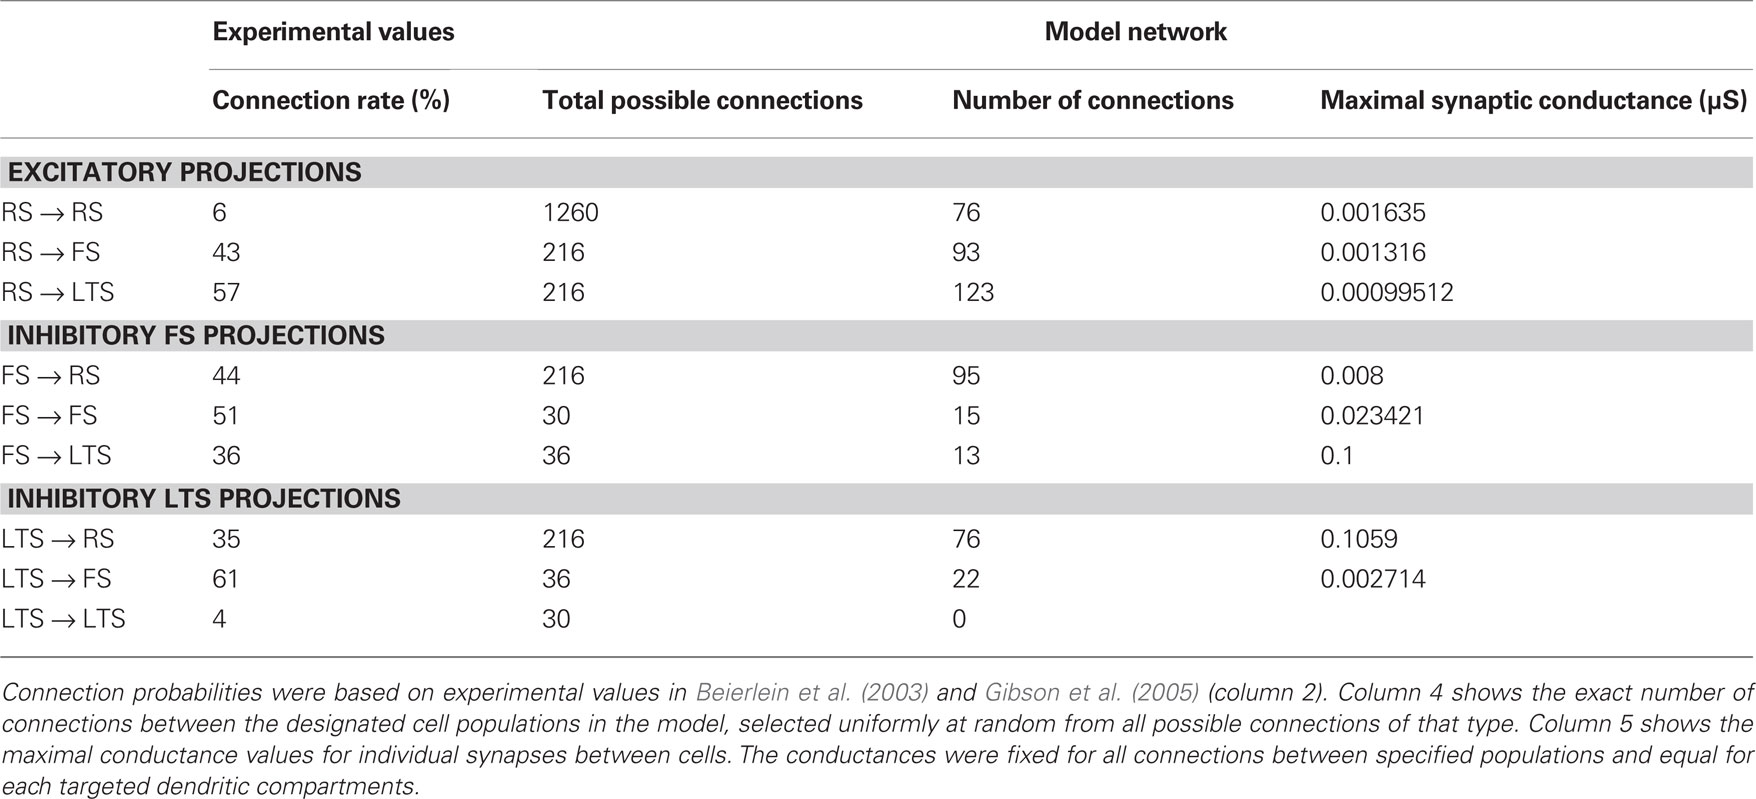
Table 3. Synaptic connectivity between cell populations.
Simulated Light Drive
Light drive was modeled as a single excitatory input with fast exponential rise (0.1 ms) and decay (3 ms) rate time constants. This excitatory pulse occurred periodically with frequency between 8 and 80 Hz, at 8 Hz intervals. For FS drive, all cells received drive with 0.03 μS maximal conductance in the soma compartment, reflecting the high transduction rates of the FS population in the experimental work (Cardin et al., 2009). For RS drive, 50% of modeled RS cells received drive, modeling the relative rate of RS transduction at the experimental recording site. For RS, the soma, and the four compartments superficial to the soma received drive with 0.005 μS maximal conductance.
Simulated Noise Processes
Noise processes in the network were selected independently for each compartment and modeled as an in vivo synaptic barrage, as in Destexhe et al. (2001), with stochastically fluctuating excitatory and inhibitory conductances [ge(t) and gi(t)]. Each conductance was governed by a process similar to the Ornstein–Uhlenbeck process (Uhlenbeck and Ornstein, 1930). Table 4 gives parameters for mean conductance (ge0 and gi0) and standard deviation (σi and σe). All other parameters were as in Destexhe et al. (2001). Noise was the primary generator of background spiking in RS cells (average spike rates of 15.7 Hz in a disconnected cells, and 9.2 Hz in network). The two most distal compartments of the modeled RS apical dendrite received synaptic noise with more variance than that in the soma and proximal dendritic compartments (Table 4). Please see results and discussion for more detail on the relevance of the chosen noise structure. The noise in FS and LTS INs were chosen such that these cells were more quiescent (average rates <1 Hz without excitatory input), and the variance was constant across compartments.
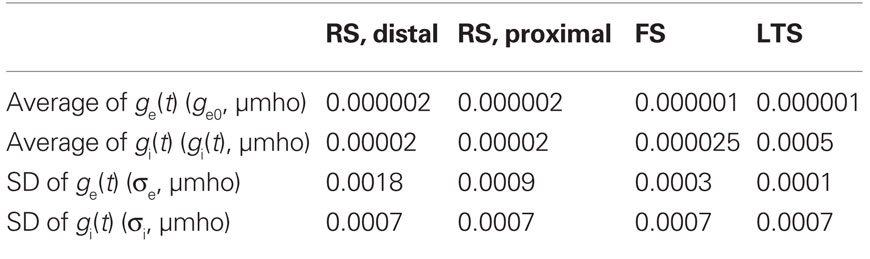
Table 4. Synaptic noise parameters for each cell type.
Comparison to Experimental Data
Calculation of spike probability response
We calculated the probability of spiking response per drive cycle as the number of spikes that occurred within 10 ms of light stimulus. For each drive frequency, the spike probability response for each cell was averaged over 15 s simulations, disregarding the first 100 ms.
Calculation of post-stimulus time histogram
We calculated a normalized post-stimulus time histogram (PSTH) of spiking over modeled RS cells. Spike times after each drive input were counted according to 2 ms bins, and normalized by the number of cycles for each frequency.
Calculation of frequency responses
Although our simplified model was not sufficient to accurately simulate a recorded LFP, we generated a model LFP by averaging voltage at the mid-apical dendrite across pyramidal cells. This procedure provides an approximation of summed network activity in pyramidal cells, which are thought to be the primary contributor to LFP (Mitzdorf, 1985, 1987). Modeled LFPs were averaged over 15 1-s trials, aligning stimulus input times.
Power estimates from the averaged LFPs were calculated from time–frequency spectrograms of the data from 1–88 Hz by convolving the signals with a complex Morlet wavelet of the form  for each frequency of interest f0, where σt = m/2πf0, and i is the imaginary unit. The normalization factor was
  , and the constant m defining the compromise between time and frequency resolution was 7. Time–frequency representations of power were calculated as the squared magnitude of the complex wavelet-transformed data. The normalization factor used is such that the sum of the magnitude of the wavelet coefficients over all frequencies is one and allows for enhanced visualization of higher frequency activity, as has been employed in previous work by our group (Jones et al., 2009; Ziegler et al., 2010).
Results
The FS–RS Model Replicated Gamma Enhancement from FS Drive, but Failed to Replicate Lower-Frequency Enhancement from RS Drive
We began by investigating the FS–RS network to test the hypothesis that biophysically realistic intrinsic properties and synaptic connectivity among these cell types is sufficient to reproduce the contrasting responses to light drive observed in vitro. We first investigated whether this network could reproduce the experimental response to FS drive (network shown schematically in Figure 3A), and found close agreement with experimental work. We then investigated whether the same network could reproduce the experimental response to RS drive, and found that it did not reproduce either the observed spike probability response or low-frequency enhancement with RS drive, as detailed here.
Figure 3. FS–RS network replicated gamma resonance with FS drive. (A) Schematic showing network connectivity and light drive. (B) FS spike probability response to a given light cycle depending on frequency (mean and SEM across six FS cells). (C) Examples of 500 ms traces of averaged stimulus locked model LFP signals for 8, 32, and 56 Hz FS drives. (D) Spectrogram from wavelet analysis of modeled LFP signal for each driving frequency. (E) Mean power at driving frequency over 1 s time-averaged LFP, which peaked at 32 Hz in the gamma range. (F) Post-stimulus time histogram averaged over complete drive cycles, normalized by number of cycles present. Shaded boxes highlight effects of FS inhibition.
FS drive
Spike probability response. FS INs followed simulated light drive with high spike probability through the gamma range, and showed decreased response probability at frequencies above 48 Hz, consistent with experimental data (compare Figure 3B and Figure 1B). Two processes governed this behavior. First, individual FS INs followed high drive rates due to their intrinsic cellular properties (Figure 2B). Second, connectivity within the FS population led to decreased probability of firing at higher frequencies, due to the time constant of GABAA inhibition.
Gamma resonance. Figure 3C shows examples of the modeled LFP over 1 s for three frequencies of FS drive, and Figure 3D shows the corresponding time–frequency spectrograms of the LFP signal at all drive frequencies. There was a band-pass power effect in the gamma range for driving frequencies from 24 to 40 Hz. Figure 3E depicts the mean power over 1 s at the driving frequency. There was a peak at 32 Hz, the low end of the gamma range, analogous to experimental data (compare Figure 3E and Figure 1A).
Figure 3F shows the corresponding PSTHs from RS cells. For FS drive frequencies from 8 to 48 Hz, suppression in RS firing was present for ∼15 ms (see red boxes in Figure 3F), reflecting GABAA type FS inhibition. This interval of suppression was in line with drive frequencies in the gamma range, which led to observed enhancement of gamma power (Figures 3D,E), and is in agreement with current theoretical understanding of network gamma generation. At low frequencies, where the interval of suppression was significantly shorter than the drive interval, noisy spiking during the non-suppressed portion of the cycle decreased power. For higher frequencies, inhibition was longer than a drive cycle, and suppressed spiking activity and decreased power.
RS drive
Failure to reproduce spike probability response. In contrast to the experimental spike probability response, which was highest at 8 Hz and fell smoothly for increased RS drive frequency, the model RS spike probability response peaked in the gamma band (compare Figure 1B and Figure 4B). We tested if the RS response could be decreased at higher frequencies by increasing RS to FS excitation or FS to RS inhibition, each of which increased the amount of network inhibition. These manipulations failed to produce the smooth decrease in spike probability response seen experimentally and undermined the band-pass response to FS drive described above (data not shown). Spike probability response could be improved by dramatically reducing noise to RS, combined with reduced RS drive, but this change completely abolished the band-pass response to FS drive (data not shown). We thus concluded that spike probability response to drive in RS cells does not follow directly from intrinsically slower firing properties in model RS cells (Figure 2B), nor from several targeted network mechanisms captured in this FS–RS model.
Figure 4. FS–RS network failed to replicate low-pass resonance with RS drive. (A) Schematic showing network connectivity and light drive. (B) RS spike probability response to a given light cycle for frequencies between 8 and 80 Hz (mean and SEM across 36 RS cells). (C) Examples of 500 ms averaged stimulus locked model LFP signals for 8, 32, and 56 Hz RS drives. (D) Spectrogram from wavelet analysis of modeled LFP signal for each driving frequency. (E) Mean power at driving frequency over 1 s time-averaged LFP, which showed a high-pass response. (F) Post-stimulus time histogram averaged over complete drive cycles, normalized by number of cycles.
Failure to evoke peak LFP enhancement at 8 Hz. We observed a high-pass response in contrast to the lower-frequency enhancement with RS drive described experimentally (compare Figure 1A and Figure 4E). A great deal of power remained in the signal for high frequency drive (Figures 4D,E) because many RS cells spiked in response to drive at high frequencies (Figure 4F). We tested if the high frequency response could be suppressed by increasing RS to FS excitation, increasing FS to RS inhibition, or alterations to the drive and noise structure, but found that any change sufficient to suppress high frequency following also suppressed response to low-frequency drive (data not shown).
The FS–RS–LTS Model Replicated Lower-Frequency Enhancement from RS Drive and Preserved Gamma Enhancement from FS Drive
Failure to replicate the RS drive response in the FS–RS network prompted testing of the second hypothesis, that a network including LTS INs could reproduce the spike probability response and lower-frequency LFP enhancement observed experimentally with RS drive (network shown schematically in Figure 5A), while preserving the band-pass FS drive response. We found that the three-population network was able to reproduce each feature, as detailed here.
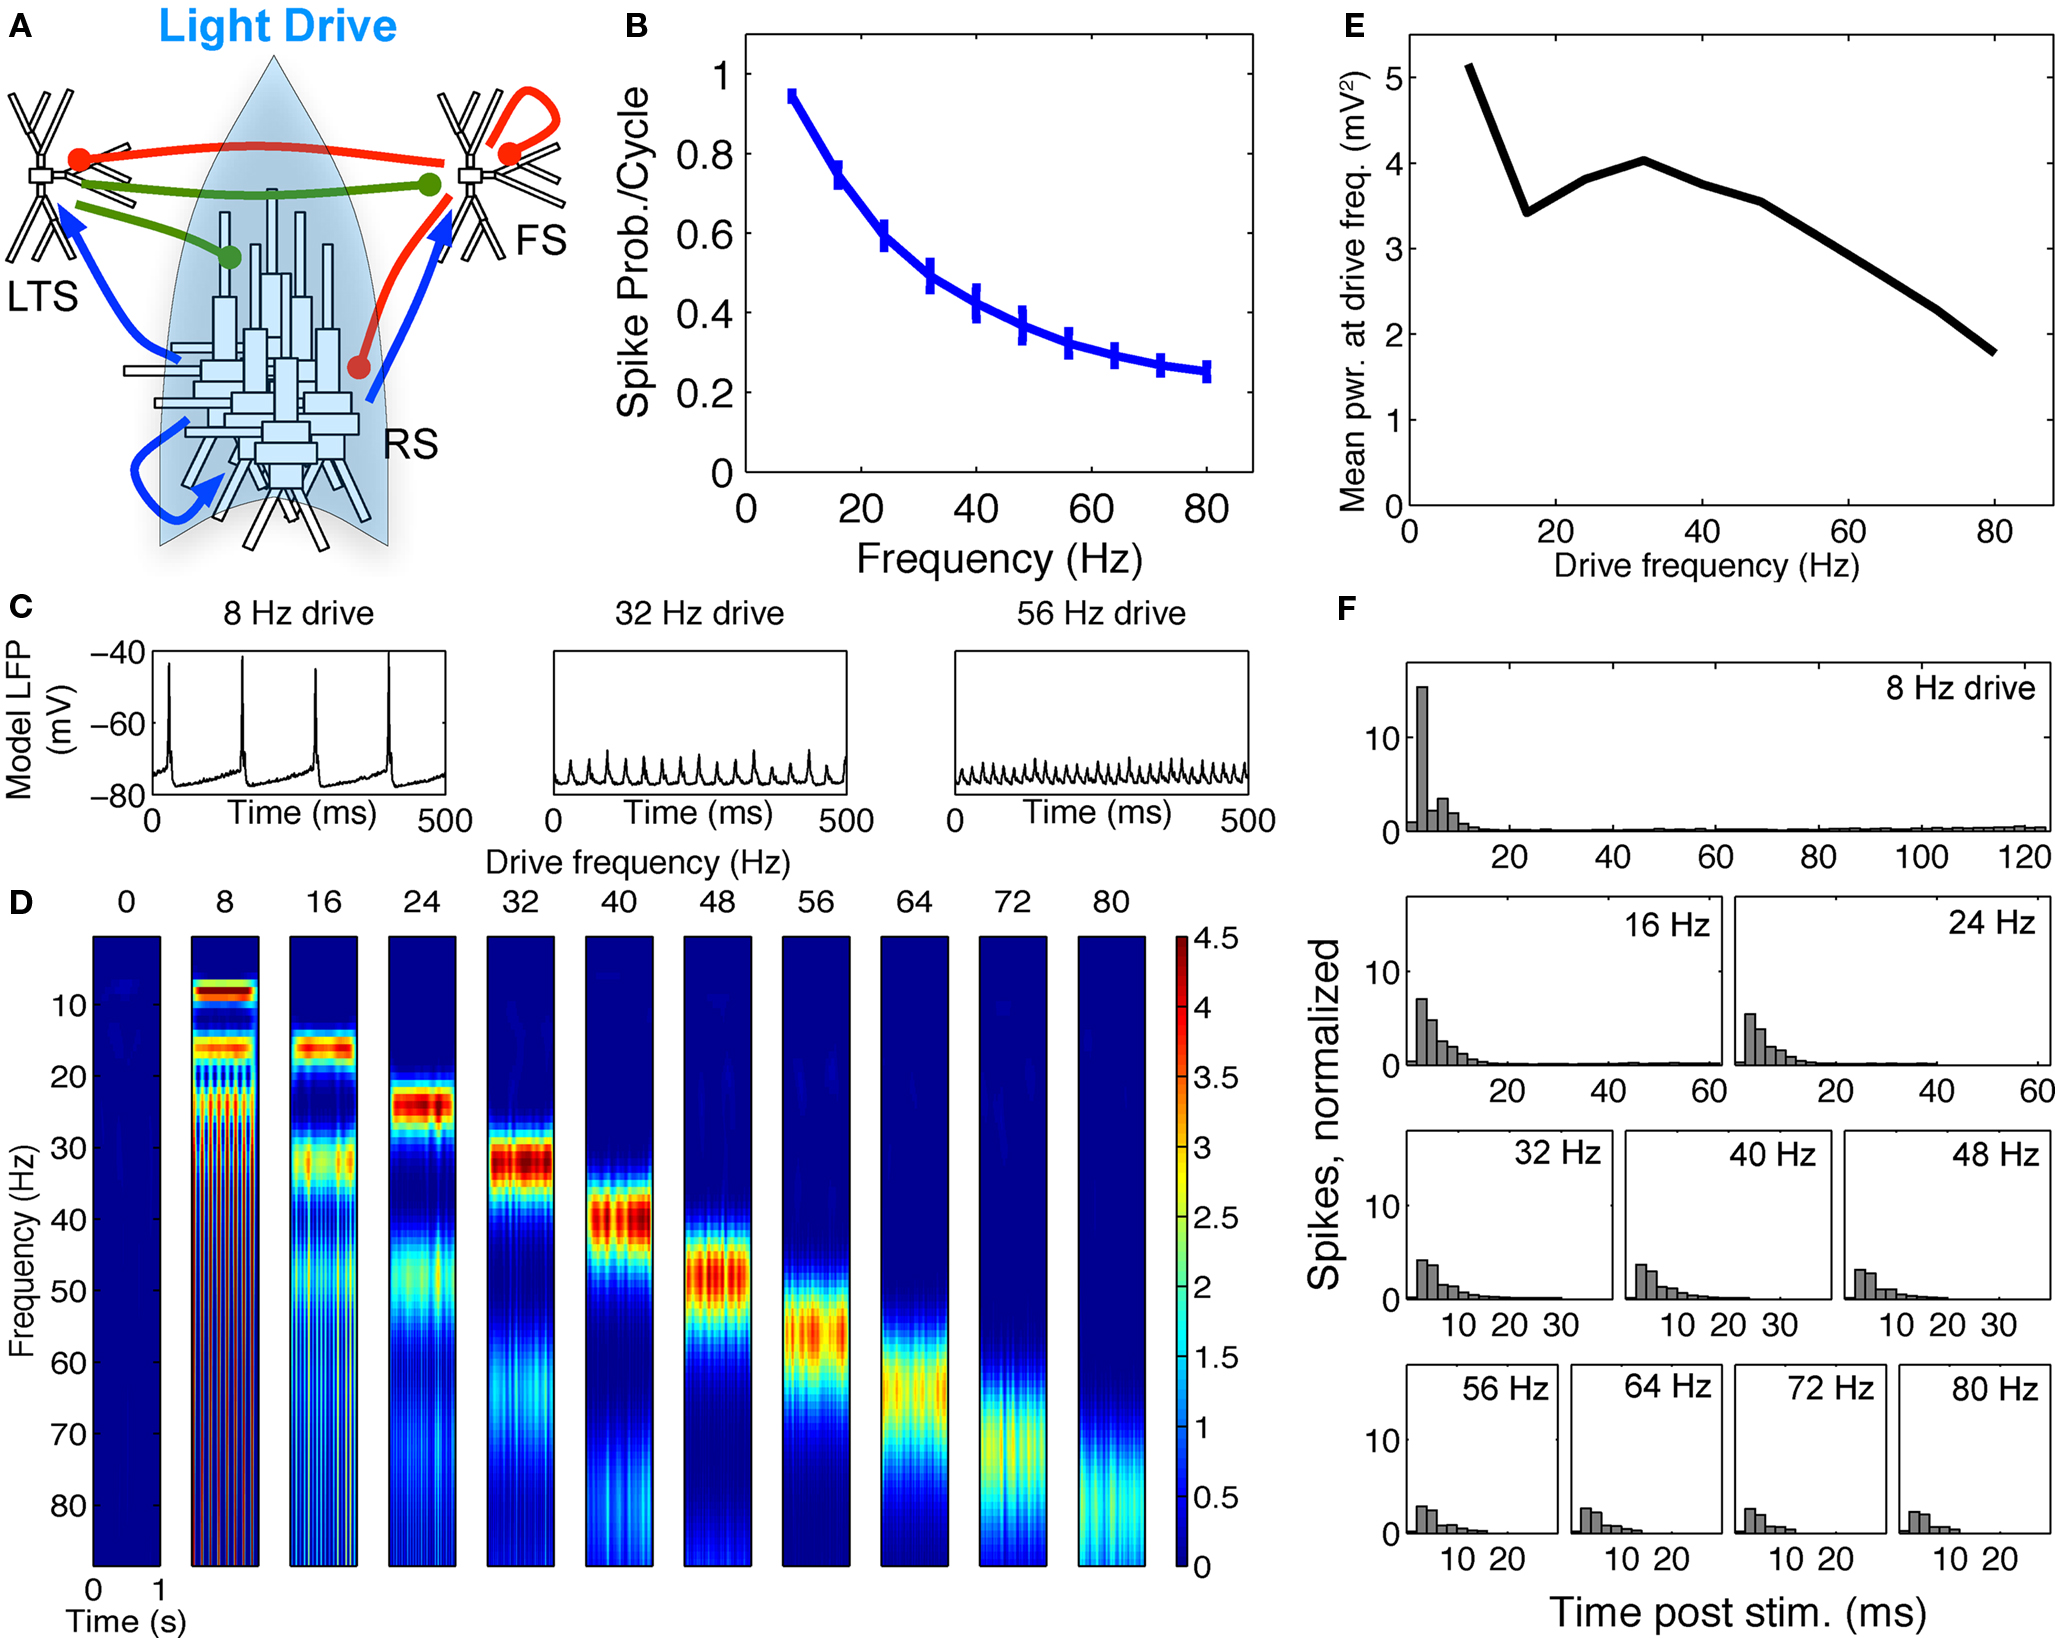
Figure 5. FS–RS–LTS network replicated low-frequency enhancement with RS drive. (A) Schematic showing network connectivity and light drive. (B) RS spike probability response to a given light cycle for frequencies between 8 and 80 Hz (mean and SEM across 36 RS cells). (C) Examples of 500 ms averaged stimulus locked model LFP signals for 8, 32, and 56 Hz drives. (D) Spectrogram from wavelet analysis of modeled LFP signal for each driving frequency. (E) Mean power at driving frequency over 1 s time-averaged LFP, which peaked at 8 Hz. (F) Post-stimulus time histogram averaged over complete drive cycles, normalized by number of cycles.
RS drive
Reproduction of spike probability response. With LTS cells included in the model, the RS spike probability response decreased smoothly as drive frequency increased, as in the experimental data (compare Figure 1B and Figure 5B). The extended inhibition produced by LTS (50 ms LTS decay rate vs. 8 ms for FS) was triggered by the highly synchronous RS activation, and shifted the spike probability response from the RS–FS network in two ways. First, at 16 Hz drive and above, the recruited LTS inhibition directly suppressed a portion of the drive-evoked RS spiking response. Second, at 8 Hz drive, LTS inhibition suppressed noise-induced spikes between drive inputs that disrupted the synchronous RS response to light drive.
Reproduction of lower-frequency LFP enhancement. Figure 5C shows examples of the modeled LFP for three frequencies of RS drive. Addition of LTS cells was sufficient to change the frequency response to RS drive observed in the FS–RS only network (Figures 4D,E) to one exhibiting low-frequency enhancement (Figures 5D,E), consistent with experimental data. With LTS present in network, more RS spikes were recruited synchronously during 8 Hz drive than at higher frequencies, as seen in the PSTH (Figure 5F) where the greatest peak amplitude occurred at 8 Hz and fell off rapidly as drive frequency increased. The PSTH was shaped by LTS inhibition that directly suppressed the RS spiking response for drives greater than 8 Hz, and also suppressed noise-generated spikes between 8 Hz drive cycles. Accordingly, the spectrogram (Figure 5D) and averaged power at driving frequency (Figure 5E) in the model LFP showed highest power at 8 Hz drive. Note, however, that in contrast to the experimental data, power showed a slight second peak in the gamma range. This reflected the intrinsic tendency to gamma rhythmicity in the network, and agrees with results more recently obtained in mice that have higher expression levels of ChR2 in a larger population of RS cells in unpublished experiments (Cardin and Moore, personal communication). All of these factors, then, likely contributed to the specific findings in the prior report, with the low-pass spike probability playing the predominant role.
FS drive
Spike response probabilities and gamma resonance were maintained. When FS INs were driven in the FS–RS–LTS network, response to FS drive was nearly identical to that in the two-population network (compare Figure 4 and Figure 6). The spectrogram and power at the driving frequency showed a band-pass effect (Figures 6D,E). The absolute peak in power at the driving frequency (Figure 6E) was in the high-“beta” range at 24 Hz, as opposed to 32 Hz in the FS–RS network, but power remained high at 32 Hz (see spectrogram at 32 Hz in Figure 6D). This slight shift in peak frequency was due to intermittent recruitment of LTS cells, which provided non-stimulus locked extended inhibition (notice difference in the 8 Hz drive LFP waveforms in Figures 3C and 6C), but the overall band-pass shape and network mechanism of the response were identical to the FS–RS network. The normalized PSTH over RS cells (Figure 6F) showed suppression for ∼20 ms following drive input, which was only slightly extended from the ∼15 ms effect in the RS–FS network (Figure 3F) (compare red boxes in Figures 3F and 6F).
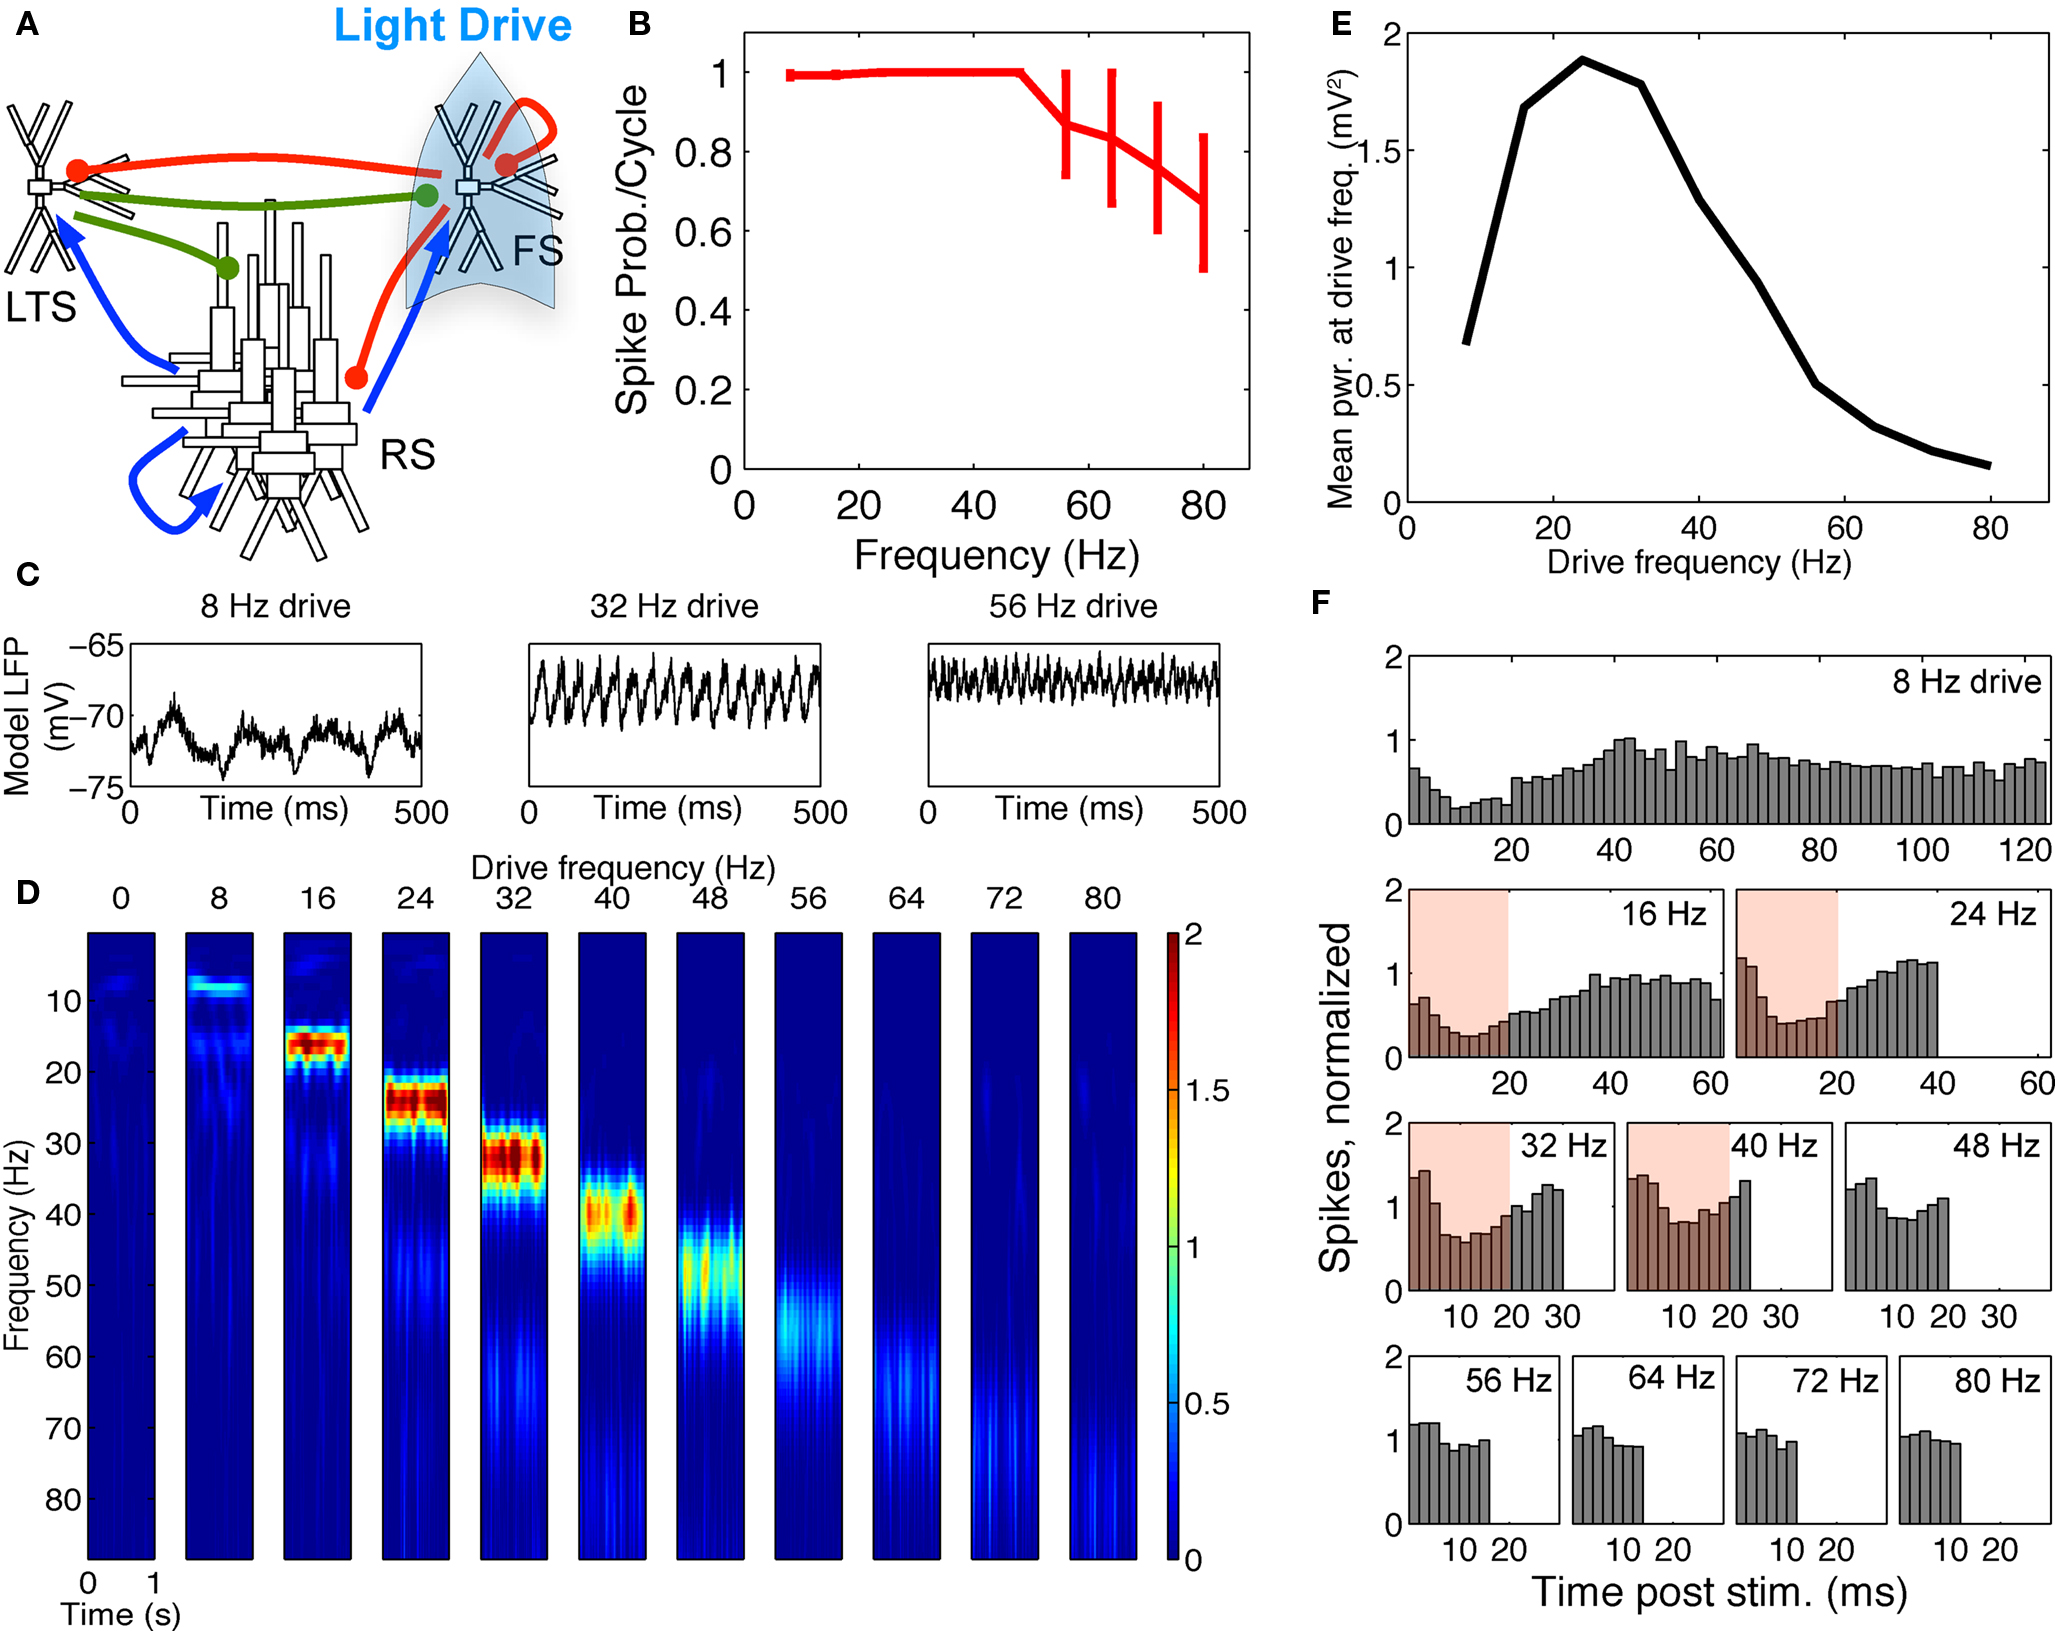
Figure 6. FS–RS–LTS preserved gamma resonance with FS drive. (A) Schematic showing network connectivity and light drive. (B) FS spike probability response to a given light cycle depending on frequency. (C) Examples of 500 ms traces of 15 time-averaged stimulus locked model LFP signals for 8, 32, and 56 Hz drives. (D) Spectrogram from wavelet analysis of modeled LFP signal for each driving frequency. (E) Mean power at driving frequency over 1 s time-averaged LFP, which showed gamma enhancement. (F) Post-stimulus time histogram averaged over complete drive cycles, normalized by number of cycles present. Shaded boxes highlight effect of FS inhibition.
Key network mechanisms responsible for contrasting resonance in FS–RS–LTS network
Four model features were essential in shaping contrasting responses to RS and FS drive in the FS–RS–LTS network. These features were LTS activation that was dependent on highly synchronous excitatory input, inhibitory connections from FS to LTS cells, the duration of LTS to RS induced inhibition and the location of noise dependent spike generation in RS cells in distal dendrites.
Highly synchronous excitatory RS input was necessary to recruit spiking in LTS cells, which ultimately generated the low-frequency enhancement in response to RS drive. To replicate experimental optogenetic drive, RS cells in the model were activated in a highly synchronous manner, and although the RS to LTS synaptic connections were facilitating, without this synchronous activation, the LTS cells were difficult to recruit. A single excitatory input could elicit LTS firing only after firing multiple spikes in quick succession. At the spike rates present in this network, facilitation was rarely engaged and, thus, RS to LTS EPSCs were typically small, and summed input across the network was required to generate LTS spikes. This requirement for synchrony promoted strong LTS activation with RS drive, and also served to limit LTS activity with FS drive, when RS activity was more asynchronous.
The FS to LTS inhibition was necessary for the band-pass response to FS drive, and was included based on in vitro recordings in mouse somatosensory cortex (Gibson et al., 2005). The FS to LTS inhibition suppressed LTS spiking during FS drive, preventing activation of slow LTS inhibition that could disrupt the gamma resonance effect. Note that even the low level of LTS inhibition present in the three-population network shifted the peak FS response peak to a slightly lower-frequency (24 Hz compared to 32 Hz, Figures 3E and 6E) highlighting the importance of keeping the LTS cells largely inactive during FS drive through synaptic inhibition.
Longer duration LTS to RS suppression, as compared to FS to RS suppression, was key to observing the lower-frequency enhancement in this network. Different reports have described the duration of LTS to RS IPSPs as either similar to those evoked by FS, as in Beierlein et al. (2003), or as up to double their duration, as in Silberberg and Markram (2007). Our results suggest that if LTS do operate to amplify low-frequency oscillations in in vivo neocortical networks, then at least a sub-population of this class will evoke longer-lasting suppression under these conditions.
Our simulations indicated that the dendritic location of noise that generated spiking in pyramidal cells may have been important for shaping the frequency response in the case of RS drive. To generate the desired spike probability response to 8 Hz RS drive, noise-induced spiking activity between drive inputs had to be largely suppressed. To achieve this suppression in the model, the majority of noise-generated RS spikes needed to be initiated in the distal dendrites, where the LTS cells had direct inhibitory control (see Materials and Methods). If instead the majority of noise-generated spikes were initiated at the soma and proximal dendrites, where the LTS cells did not provide direct inhibition, the 8 Hz response was compromised (data not shown). While a completely quiescent resting state network would have also yielded the same RS entrainment result, a moderate level of background spiking was essential for the band-pass response to FS drive. These findings imply that LTS will have the greatest impact on lower-frequency oscillations under conditions where the primary source of non-signal related input is directed to the distal dendrites (see Discussion).
Discussion
Overview of Findings
We examined possible cellular and network underpinnings of contrasting cortical responses to direct optogenetic drive of RS and FS cells in vivo (Cardin et al., 2009). We found that, while gamma band enhancement with FS drive was replicable in a canonical FS–RS network, lower-frequency enhancement with RS drive was not, despite the inclusion of RS cells with realistic intrinsic biophysical properties (Figure 2B). Reproduction of lower-frequency enhancement with RS drive required the addition of a LTS inhibitory population that generated extended inhibition, and the location of noise-generated spikes primarily in the distal dendrites, where LTS provided direct inhibition. Maintaining gamma resonance with FS drive in the full FS–RS–LTS network required that the LTS cells be inactivated during FS drive. This suppression of LTS activity was achieved through the presence of FS to LTS inhibition and the requirement that LTS INs receive a high level of synchronous RS input in order to fire, which did not occur with FS drive, consistent with supplementary data in Cardin et al. (2009) showing sparse RS contributions across the network during FS drive.
Alternate Mechanisms for Low-Frequency Network Oscillations
Previous experimental and computational work examining low-frequency theta (4–12 Hz) rhythms in hippocampus has highlighted the role of O-LM cells, which share key features with cortical LTS cells (Gloveli et al., 2005; Rotstein et al., 2005; Tort et al., 2007). These features include extended inhibition from O-LM cells and the location of O-LM projections onto distal dendrites of pyramidal neurons. Rotstein et al. (2005) modeled purely inhibitory interactions and found that moderately extended O-LM inhibition (20 ms decay rate time constant for O-LM inhibition compared to 8 ms for FS) operated in concert with the h-current and fast FS inhibition to generate the modeled theta rhythm. In Tort et al. (2007), theta rhythmicity in hippocampal pyramidal dendrites was generated by an h-current mechanism. Further, the dendritic location and long spatial span of O-LM connections onto pyramidal cells mediated theta range modulation of gamma-coherent assemblies, a network behavior we do not investigate. Extended O-LM inhibition was not emphasized as being necessary for either dendritic theta generation or theta modulation of gamma rhythmicity. In Gloveli et al. (2005), a more simplified six-cell network containing O-LM, FS, and excitatory RS cells transitioned from gamma to theta as O-LM synaptic strength was increased and FS synaptic strength was decreased. Network theta rhythmicity was generated by a combination of extended O-LM inhibition (20 ms decay) and intrinsic 10 Hz rhythmicity in the O-LM cells, governed by intrinsic parameters, including the h-current and the selected level of applied current.
In comparison to the mechanisms of theta generation in hippocampal models, in our model, the primary parameter controlling low-frequency enhancement with rhythmic RS drive is the long time constant of LTS inhibition (50 ms decay rate time constant for LTS compared to 8 ms for FS). The intrinsic kinetics of the h-current included in our LTS cells contributed to the spike frequency response properties (Figure 2B) but did not play a dominant role in low-frequency network dynamics. The 50 ms decay time constant for LTS inhibition is longer than that of O-LM inhibition in the hippocampal models, and a direct prediction from our results is that cortical LTS cells produce markedly extended inhibition compared to FS. This prediction is currently ambiguous in the experimental literature. Work by Silberberg and Markram (2007) suggests that cortical LTS cells do produce a significantly longer time constant of inhibition than FS cells, but in contrast Beierlein et al. (2003) found no difference in IPSP duration. Another critical feature of our model that is different than the hippocampal models is the dependence of LTS activation on highly synchronous excitatory input, which stems from our inclusion of realistic synaptic dynamics (Kapfer et al., 2007). Differential excitatory cell input to the two inhibitory cell populations (e.g., facilitating input to LTS and depressing to FS) is a necessary feature of our model, and leads to the prediction that contrasting excitatory to LTS vs. FS synaptic dynamics may be critical in delineating the network role of these distinct inhibitory populations.
Our model predicts that cortical LTS inhibition contributes to enhancement of lower-frequency rhythms during direct rhythmic RS drive. Previous work has suggested that intrinsic currents in layer V pyramidal cells, namely h and T currents, can also regulate low-frequency alpha range (7–14 Hz) cortical rhythmicity (Silva et al., 1991; Jones et al., 2000, 2009; Pinto et al., 2003) or enhance thalamic–cortical alpha resonance (Hughes and Crunelli, 2005). In particular, h and T currents are known to produce ∼8 Hz rhythms in the distal dendrites of Layer V pyramidal cells in rat (Ulrich, 2002). However, we do not expect this mechanism contributes to the low-frequency resonance with RS drive described here. Tetrode recordings during the light activation experiments indicated that layer II/III RS units were driven by the optogenetic drive, but layer V RS units were not driven (Cardin et al., 2009). Our model was restricted to layer II/III specific pyramidal neurons, which have a low density of Ih in both soma and dendrites (Larkum et al., 2007). In an extended cortical network model that includes both layer II/III and bursting layer V pyramidal neurons it is possible that the intrinsic properties of the layer V pyramidal neurons would facilitate the resonance of the network to the low-frequency drive of the layer II/III RS cells.
Implications for Network Function Under Biologically Realistic Conditions
The present findings provide evidence in agreement with most views regarding network mechanisms of gamma emergence. We therefore do not focus our discussion on these findings. In contrast, the dependence of lower-frequency enhancement on cortical LTS recruitment during RS drive is a novel prediction with potential implications for network function under biologically plausible conditions. The lower-frequency enhancement with LTS depended critically on excitatory drive to LTS INs at the frequencies in question (in this case, resulting from optogenetic drive to RS cells) and on a stringent requirement for synchrony in pre-synaptic excitatory input to recruit LTS. Further, the network behavior was robust only when “noisy” or non-frequency locked spikes emerged from distal dendritic inputs.
As such, LTS may act to amplify an already present lower-frequency oscillation when these conditions are met. Highly synchronous drive from the thalamus at frequencies in, for example, the 8 Hz alpha band could provide one such source of input. While direct thalamic projections do not terminate on LTS cells in layer IV of barrel cortex (Beierlein et al., 2003), synchronous output of second-order cortical neurons could suffice to drive these cells, and there is evidence for thalamic input to LTS whose cell bodies are in non-granular layers (Tan et al., 2008). If this 8 Hz rhythmicity were present under conditions that favored “noisy” or non-frequency locked input to the distal dendrites, such as from intracortical input or non-lemniscal thalamus (Jones, 2001), then our model indicates LTS recruitment could amplify these low-frequency rhythms. We note that states associated with low-cholinergic tone, such as inattentiveness and sleep, are linked to both strong thalamic alpha activity and enhancement of intracortical feedback connections onto distal dendrites of pyramidal cells (Hasselmo and McGaughy, 2004). In such states, strong alpha frequency thalamic input to cortex could be analogous to synchronous ∼8 Hz RS activity driven by light, while enhanced intracortical connections could mimic the role of non-frequency-locked distal noise onto pyramidal cells. These two features indicate a convergence of conditions favoring a role for LTS enhancement of cortical alpha activity during “inattentiveness”. While LTS cells are known to be depolarized by nicotinic receptors (Xiang et al., 1998) and thus might be expected to be less active during low-cholinergic states in vivo, our modeling indicates that sufficient synchronous RS input, such as that driven directly by light or by a strong synchronous thalamic alpha rhythm, could be the dominant feature triggering LTS activity. During states of “attentiveness” and high-cholinergic tone, depolarized LTS may be more spontaneously and asynchronously active (Xiang et al., 1998), and in this state, they may instead play a role of inhibiting noisy activity in more distal layers to support gamma or other fast rhythms generated near the soma by FS inhibition.
In summary, our results confirm the potential importance of LTS INs in regulating low-frequency cortical activity and suggest they should be considered when investigating network mechanisms of cortical oscillations in vivo.
Conflict of Interest Statement
The authors declare that the research was conducted in the absence of any commercial or financial relationships that could be construed as a potential conflict of interest.
Acknowledgments
We thank M. Kramer, U. Knoblich, and R. Haslinger for helpful conversations regarding data analysis, and M. Sikora for consultation on NEURON programming. Work supported by the MGH Claflin Award for Distinguished Scholarship, NIH grant K25MH07294, and NIH grant F32NS063694.
Footnote
- ^http://senselab.med.yale.edu/modeldb/ShowModel.asp?model=113732.
- ^https://senselab.med.yale.edu/modeldb/ShowModel.asp?model=2488.
References
Bartos, M., Vida, I., and Jonas, P. (2007). Synaptic mechanisms of synchronized gamma oscillations in inhibitory interneuron networks. Nat. Rev. Neurosci. 8, 45–56.
Beierlein, M., Gibson, J. R., and Connors, B. W. (2003). Two dynamically distinct inhibitory networks in layer 4 of the neocortex. J. Neurophysiol. 90, 2987–3000.
Borgers, C., and Kopell, N. (2005). Effects of noisy drive on rhythms in networks of excitatory and inhibitory neurons. Neural Comput. 17, 557–608.
Bush, P. C., and Sejnowski, T. J. (1993). Reduced compartmental models of neocortical pyramidal cells. J. Neurosci. Methods 46, 159–166.
Cardin, J. A., Carlen, M., Meletis, K., Knoblich, U., Zhang, F., Deisseroth, K., Tsai, L. H., and Moore, C. I. (2009). Driving fast-spiking cells induces gamma rhythm and controls sensory responses. Nature. 459, 663-667.
Castro-Alamancos, M. A., and Connors, B. W. (1996). Cellular mechanisms of the augmenting response: short-term plasticity in a thalamocortical pathway. J. Neurosci. 16, 7742–7756.
Cauli, B., Audinat, E., Lambolez, B., Angulo, M. C., Ropert, N., Tsuzuki, K., Hestrin, S., and Rossier, J. (1997). Molecular and physiological diversity of cortical nonpyramidal cells. J. Neurosci. 17, 3894–3906.
Contreras, D., and Steriade, M. (1995). Cellular basis of EEG slow rhythms: a study of dynamic corticothalamic relationships. J. Neurosci. 15, 604–622.
Deisseroth, K., Feng, G., Majewska, A. K., Miesenbock, G., Ting, A., and Schnitzer, M. J. (2006). Next-generation optical technologies for illuminating genetically targeted brain circuits. J. Neurosci. 26, 10380–10386.
Destexhe, A., Rudolph, M., Fellous, J. M., and Sejnowski, T. J. (2001). Fluctuating synaptic conductances recreate in vivo-like activity in neocortical neurons. Neuroscience 107, 13–24.
Fanselow, E. E., Richardson, K. A., and Connors, B. W. (2008). Selective, state-dependent activation of somatostatin-expressing inhibitory interneurons in mouse neocortex. J. Neurophysiol. 100, 2640–2652.
Garabedian, C. E., Jones, S. R., Merzenich, M. M., Dale, A., and Moore, C. I. (2003). Band-pass response properties of rat SI neurons. J. Neurophysiol. 90, 1379–1391.
Gibson, J. R., Beierlein, M., and Connors, B. W. (2005). Functional properties of electrical synapses between inhibitory interneurons of neocortical layer 4. J. Neurophysiol. 93, 467–480.
Gloveli, T., Dugladze, T., Rotstein, H. G., Traub, R. D., Monyer, H., Heinemann, U., Whittington, M. A., and Kopell, N. J. (2005). Orthogonal arrangement of rhythm-generating microcircuits in the hippocampus. Proc. Natl. Acad. Sci. U.S.A. 102, 13295–13300.
Goldberg, J. H., and Yuste, R. (2005). Space matters: local and global dendritic Ca2+ compartmentalization in cortical interneurons. Trends Neurosci. 28, 158–167.
Hasselmo, M. E., and McGaughy, J. (2004). High acetylcholine levels set circuit dynamics for attention and encoding and low acetylcholine levels set dynamics for consolidation. Prog. Brain Res. 145, 207–231.
Herrmann, C. S., and Demiralp, T. (2005). Human EEG gamma oscillations in neuropsychiatric disorders. Clin Neurophysiol 116, 2719–2733.
Hughes, S. W., and Crunelli, V. (2005). Thalamic mechanisms of EEG alpha rhythms and their pathological implications. Neuroscientist 11, 357–372.
Jensen, O., Kaiser, J., and Lachaux, J. P. (2007). Human gamma-frequency oscillations associated with attention and memory. Trends Neurosci. 30, 317–324.
Jones, E. G. (2001). The thalamic matrix and thalamocortical synchrony. Trends Neurosci. 24, 595–601.
Jones, S. R., Pinto, D. J., Kaper, T. J., and Kopell, N. (2000). Alpha-frequency rhythms desynchronize over long cortical distances: a modeling study. J. Comput. Neurosci. 9, 271–291.
Jones, S. R., Pritchett, D. L., Sikora, M. A., Stufflebeam, S. M., Hamalainen, M., and Moore, C. I. (2009). Quantitative analysis and biophysically realistic neural modeling of the MEG mu rhythm: rhythmogenesis and modulation of sensory-evoked responses. J. Neurophysiol. 102, 3554–3572.
Jones, S. R., Pritchett, D. L., Stufflebeam, S. M., Hamalainen, M., and Moore, C. I. (2007). Neural correlates of tactile detection: a combined magnetoencephalography and biophysically based computational modeling study. J. Neurosci. 27, 10751–10764.
Kapfer, C., Glickfeld, L. L., Atallah, B. V., and Scanziani, M. (2007). Supralinear increase of recurrent inhibition during sparse activity in the somatosensory cortex. Nat. Neurosci. 10, 743–753.
Kawaguchi, Y. (1995). Physiological subgroups of nonpyramidal cells with specific morphological characteristics in layer II/III of rat frontal cortex. J. Neurosci. 15, 2638–2655.
Larkum, M. E., Waters, J., Sakmann, B., and Helmchen, F. (2007). Dendritic spikes in apical dendrites of neocortical layer 2/3 pyramidal neurons. J. Neurosci. 27, 8999–9008.
Ma, Y., Hu, H., Berrebi, A. S., Mathers, P. H., and Agmon, A. (2006). Distinct subtypes of somatostatin-containing neocortical interneurons revealed in transgenic mice. J. Neurosci. 26, 5069–5082.
Mainen, Z. F., and Sejnowski, T. J. (1996). Influence of dendritic structure on firing pattern in model neocortical neurons. Nature 382, 363–366.
Mann, E. O., and Paulsen, O. (2007). Role of GABAergic inhibition in hippocampal network oscillations. Trends Neurosci. 30, 343–349.
Markram, H., Toledo-Rodriguez, M., Wang, Y., Gupta, A., Silberberg, G., and Wu, C. (2004). Interneurons of the neocortical inhibitory system. Nat. Rev. Neurosci. 5, 793–807.
Mason, A., and Larkman, A. (1990). Correlations between morphology and electrophysiology of pyramidal neurons in slices of rat visual cortex. II. Electrophysiology. J. Neurosci. 10, 1415–1428.
Mitzdorf, U. (1985). Current source-density method and application in cat cerebral cortex: investigation of evoked potentials and EEG phenomena. Physiol. Rev. 65, 37–100.
Mitzdorf, U. (1987). Properties of the evoked potential generators: current source-density analysis of visually evoked potentials in the cat cortex. Int. J. Neurosci. 33, 33–59.
Pinto, D. J., Jones, S. R., Kaper, T. J., and Kopell, N. (2003). Analysis of state-dependent transitions in frequency and long-distance coordination in a model oscillatory cortical circuit. J. Comput. Neurosci. 15, 283–298.
Ren, J. Q., Aika, Y., Heizmann, C. W., and Kosaka, T. (1992). Quantitative analysis of neurons and glial cells in the rat somatosensory cortex, with special reference to GABAergic neurons and parvalbumin-containing neurons. Exp. Brain Res. 92, 1–14.
Rotstein, H. G., Pervouchine, D. D., Acker, C. D., Gillies, M. J., White, J. A., Buhl, E. H., Whittington, M. A., and Kopell, N. (2005). Slow and fast inhibition and an H-current interact to create a theta rhythm in a model of CA1 interneuron network. J. Neurophysiol. 94, 1509–1518.
Salin, P. A., and Prince, D. A. (1996). Spontaneous GABAA receptor-mediated inhibitory currents in adult rat somatosensory cortex. J. Neurophysiol. 75, 1573–1588.
Silberberg, G., and Markram, H. (2007). Disynaptic inhibition between neocortical pyramidal cells mediated by Martinotti cells. Neuron 53, 735–746.
Silva, L. R., Amitai, Y., and Connors, B. W. (1991). Intrinsic oscillations of neocortex generated by layer 5 pyramidal neurons. Science 251, 432–435.
Tallon-Baudry, C. (2009). The roles of gamma-band oscillatory synchrony in human visual cognition. Front. Biosci. 14, 321–332.
Tan, Z., Hu, H., Huang, Z. J., and Agmon, A. (2008). Robust but delayed thalamocortical activation of dendritic-targeting inhibitory interneurons. Proc. Natl. Acad. Sci. U.S.A. 105, 2187–2192.
Tateno, T., Harsch, A., and Robinson, H. P. (2004). Threshold firing frequency-current relationships of neurons in rat somatosensory cortex: type 1 and type 2 dynamics. J. Neurophysiol. 92, 2283–2294.
Tiesinga, P., and Sejnowski, T. J. (2009). Cortical enlightenment: are attentional gamma oscillations driven by ING or PING? Neuron 63, 727–732.
Tort, A. B., Rotstein, H. G., Dugladze, T., Gloveli, T., and Kopell, N. J. (2007). On the formation of gamma-coherent cell assemblies by oriens lacunosum-moleculare interneurons in the hippocampus. Proc. Natl. Acad. Sci. U.S.A. 104, 13490–13495.
Uhlenbeck, G. E., and Ornstein, L. S. (1930). On the theory of the Brownian motion. Phys. Rev. 36, 0823–0841.
Ulrich, D. (2002). Dendritic resonance in rat neocortical pyramidal cells. J. Neurophysiol. 87, 2753–2759.
Varela, J. A., Sen, K., Gibson, J., Fost, J., Abbott, L. F., and Nelson, S. B. (1997). A quantitative description of short-term plasticity at excitatory synapses in layer 2/3 of rat primary visual cortex. J. Neurosci. 17, 7926–7940.
Whittington, M. A., Traub, R. D., and Jefferys, J. G. (1995). Synchronized oscillations in interneuron networks driven by metabotropic glutamate receptor activation. Nature 373, 612–615.
Whittington, M. A., Traub, R. D., Kopell, N., Ermentrout, B., and Buhl, E. H. (2000). Inhibition-based rhythms: experimental and mathematical observations on network dynamics. Int. J. Psychophysiol. 38, 315–336.
Xiang, Z., Huguenard, J. R., and Prince, D. A. (1998). Cholinergic switching within neocortical inhibitory networks. Science 281, 985–988.
Ziegler, D. A., Pritchett, D. L., Hosseini-Varnamkhasti, P., Corkin, S., Hamalainen, M., Moore, C. I., and Jones, S. R. (2010). Transformations in oscillatory activity and evoked responses in primary somatosensory cortex in middle age: a combined computational neural modeling and MEG study. Neuroimage. 52, 897–912.
Keywords: gamma, GABA, channelrhodopsin, low-threshold spiking, fast-spiking, interneurons, somatosensory cortex
Citation: Vierling-Claassen D, Cardin JA, Moore CI and Jones SR (2010) Computational modeling of distinct neocortical oscillations driven by cell-type selective optogenetic drive: separable resonant circuits controlled by low-threshold spiking and fast-spiking interneurons. Front. Hum. Neurosci. 4:198. doi: 10.3389/fnhum.2010.00198
Received: 01 June 2010;
Accepted: 29 September 2010;
Published online: 22 November 2010.
Edited by:
Thilo Womelsdorf, Robarts Research Institute London, CanadaCopyright: © 2010 Vierling-Claassen, Cardin, Moore and Jones. This is an open-access article subject to an exclusive license agreement between the authors and the Frontiers Research Foundation, which permits unrestricted use, distribution, and reproduction in any medium, provided the original authors and source are credited.
*Correspondence: Stephanie R. Jones, Athinoula A. Martinos Center for Biomedical Imaging, 149 Thirteenth Street, Suite 2301, Charlestown, MA 02129, USA. e-mail: srjones@nmr.mgh.harvard.edu