

Article Figures & Data
Figures
- Figure 1.
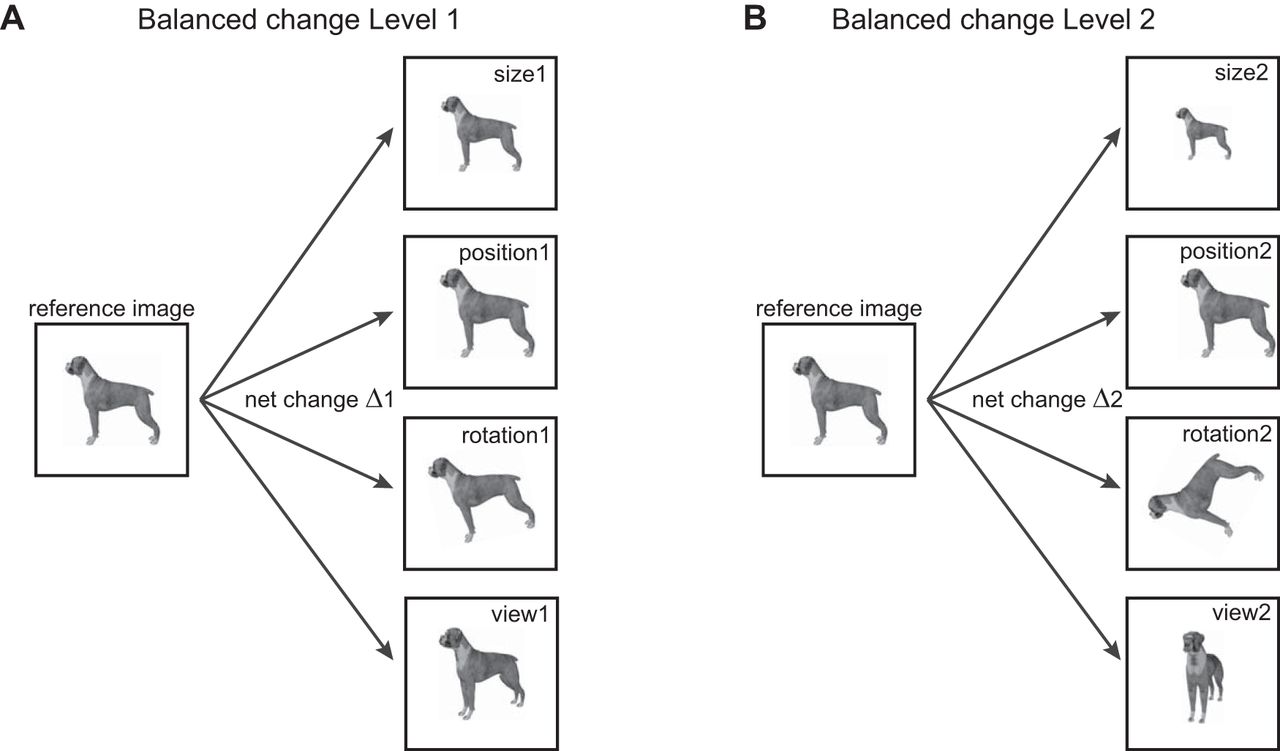
Schematic of experiment design. To compare invariances in the brain, we designed stimuli in which the net change in the image was identical across a number of identity-preserving transformations. A, For balanced change level 1, we transformed the reference image in either size, position, in-plane rotation or view (i.e., in-depth rotation), with the constraint that the net change in the image is equal (depicted by Δ1). B, Same as A but for change level 2.
- Figure 2.
Example IT neuron. Responses of an example IT neuron for a subset of six objects across all transformations (levels 1 and 2 for size, position, rotation, and view). In each subplot, the starting point is the image onset time, each row is a single trial and ticks indicate spike times. The histogram above the raster represents the firing rate in 20-ms bins.
- Figure 3.
Dynamics of invariance in IT neurons. A, To quantify size invariance, we calculated the correlation between the responses to the reference images of all objects (top row) and the responses to size-transformed images of these objects (bottom row). B, Average size, position, rotation, and view invariance across all neurons for balanced change level 1 (left) and level 2 (right). Error bars indicate SEM. Asterisks indicate statistical significance (* is p < 0.05, ** is p < 0.005, *** is p < 0.0005, **** is p < 0.00005). C, Average size, position, rotation, and view invariances (for change level 1) in 20-ms bins during the image presentation period (200 ms). Vertical dashed lines indicate the peak latency for each invariance type. The average normalized neural response (across all cells and stimuli) is displayed (cyan dashed line) for comparison. D, Same as C but for larger changes (level 2). The gray bar near the x-axis represents the time period during which the average of size and position invariance was significantly larger than the average of rotation and view invariance (p < 0.05, rank-sum test across invariances of 127 neurons in each time bin).
- Figure 4.
Dynamics of invariant population decoding in IT. A, To quantify invariant decoding at the level of the neural population, we trained linear classifiers to identify objects in their reference images, and asked whether the same classifiers would generalize to transformed object images (in this case, to size 1). High decoding accuracy implies strong size invariance. B, Invariant object decoding accuracy for size, position, rotation, and view for change level 1 (left) and change level 2 (right). Error bars indicate the SEM accuracy across trials. Asterisks indicate statistical significance as before. C, Invariant object decoding accuracy for level 1 changes of size, position, rotation, and view calculated in 20-ms time bins throughout the visual response period. Thick lines indicate mean decoding accuracy, and shaded regions indicate the standard deviation estimated from 100 bootstrap estimates obtained by sampling neurons with replacement. The dotted line indicates chance decoding performance (10%). The gray bar near the x-axis represents the time bins during which view decoding was significantly smaller than size, position, and rotation decoding (p < 0.05, rank-sum test across trial-wise decoding accuracy for view versus others). The average normalized neural response (across all cells and stimuli) is displayed (cyan dashed line) for comparison. D, Same as C but for change level 2.
- Figure 5.
Invariances covary across neurons. A, Position invariance plotted against rotation invariance across all neurons for level 1 changes. The dashed line is the unit slope line and the solid line represents the best linear fit. Position invariant neurons are marked by black circles, rotation invariant neurons are marked by red plus symbols, and all other cells are marked using gray circles. B, Correlations between all pairs of invariances across neurons. Asterisks represent statistical significance as before.
- Figure 6.
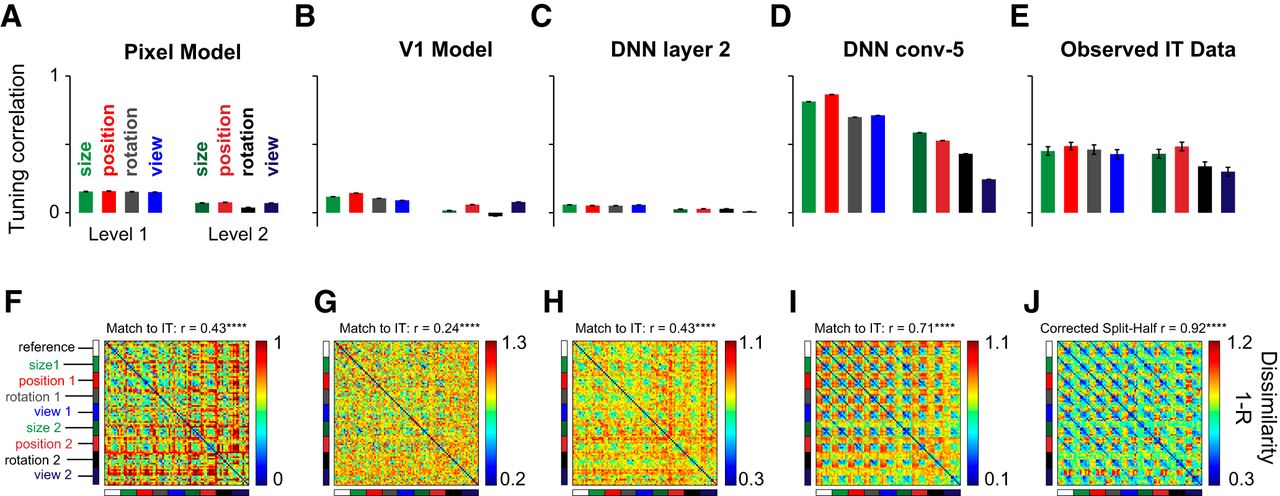
Comparison with computational models. To investigate whether the invariance differences observed in IT are a trivial consequence of low-level visual representations or reflect the underlying complexity, we compared the IT representation with several models: pixel, V1, and initial and later layers of a deep neural network i.e. DNN (see text). A, Average invariance, measured as the tuning correlation between reference images and transformed images across objects for the pixel model. The bars indicate the mean tuning correlation and the error bars indicate the SEM across all units. B–E, Same as A, but for the V1, DNN layer 2, DNN conv-5, and IT neurons. F, Pairwise dissimilarity between all pairs of 90 stimuli for the pixel model. The match to IT indicates the correlation between this matrix and the observed dissimilarities in IT (depicted in J). G–I, Same as F but for the V1, DNN layer 2, and DNN conv-5 layer, respectively. J, Same as F but for IT neurons. The correlation above the color map represents the reliability of the IT data, which is an estimate of the upper bound achievable for any model of IT (see Materials and Methods).


In this issue


