

Article Figures & Data
Figures
- Figure 1.
Endogenous Ikbkap expression in the retina. Representative LacZ staining on Ikbkap:β-gal retina or β-galactosidase IHC images are shown. A, At E15.5, Ikbkap expression was detected in developing RGCs in the GCL. N, nasal; T, temporal. B, P7 retina showed strong expression in the GCL. There was no regional bias or asymmetry in the expression pattern. C, At 1 month, RGCs, amacrine cells, subset of bipolar cells, and photoreceptors (IS and outer plexiform layer) expressed IKAP. D, At 1 month, antibody staining showed the same pattern of Ikbkap expression as LacZ staining. E, All RGCs (RBPMS+, green) expressed Ikbkap (red; bottom). F, Many amacrine cells (AP2α+) expressed Ikbkap (red; arrowheads). G, A subset of bipolar cells (Otx2+ in INL) expressed Ikbkap (red; arrows). H, Müller glial marker Sox2 (green) did not colocalize with β-gal (red; arrows), suggesting that they do not express Ikbkap. Some of the Sox2+ amacrine cells expressed Ikbkap (arrowheads). NBL, neuroblastic layer. Scale bars, 1 mm (A, top), 50 μm (A, bottom), 500 μm (B), 250 μm (C, top), 25 μm (C, bottom), and 50 μm (D–H).
- Figure 2.
Tα1-Cre mice were crossed to mTmG Cre reporter, and GFP expression was analyzed at E17.5, P10, and 1 and 8 months. A and B, At E17.5, Cre expression (GFP+) was detected in the GCL without regional bias. GFP colocalized with pan-RGC marker RBPMS (white). C, GFP was detected in the optic nerve at E17.5, indicating Cre expression in RGCs. D, Very few cells other than RGCs expressed Cre (GFP+) at P10. E, Most RGCs (RBPMS+) expressed Cre (GFP+) at P10. Representative images at the temporal retina are shown. F, Approximately 90% of RGCs expressed Cre by P10, and there was no regional bias. Error bars represent SEM (n = 4). Central, >0.25 mm from ONH; temporal and nasal, 1 mm from ONH. G–K, Cell type–specific markers were used to analyze Cre expression in the retina at 1 month. Very few bipolar cells (BP; Otx2+ in INL; G, J), amacrine cells (AC; G), photoreceptors (PR; G, K), or Müller glia (MG; Sox9+; H, J) expressed Cre, whereas Cre expression was detected in ∼90% of RGCs (RBPMS+; I, J). Cre-expressing photoreceptor numbers did not increase in older retinas (8 months) compared with 1 month (K). Error bars in J and K represent SEM (n = 3). NBL, neuroblastic layer. Scale bars, 250 μm (A–C) and 50 μm (G–I).
- Figure 3.
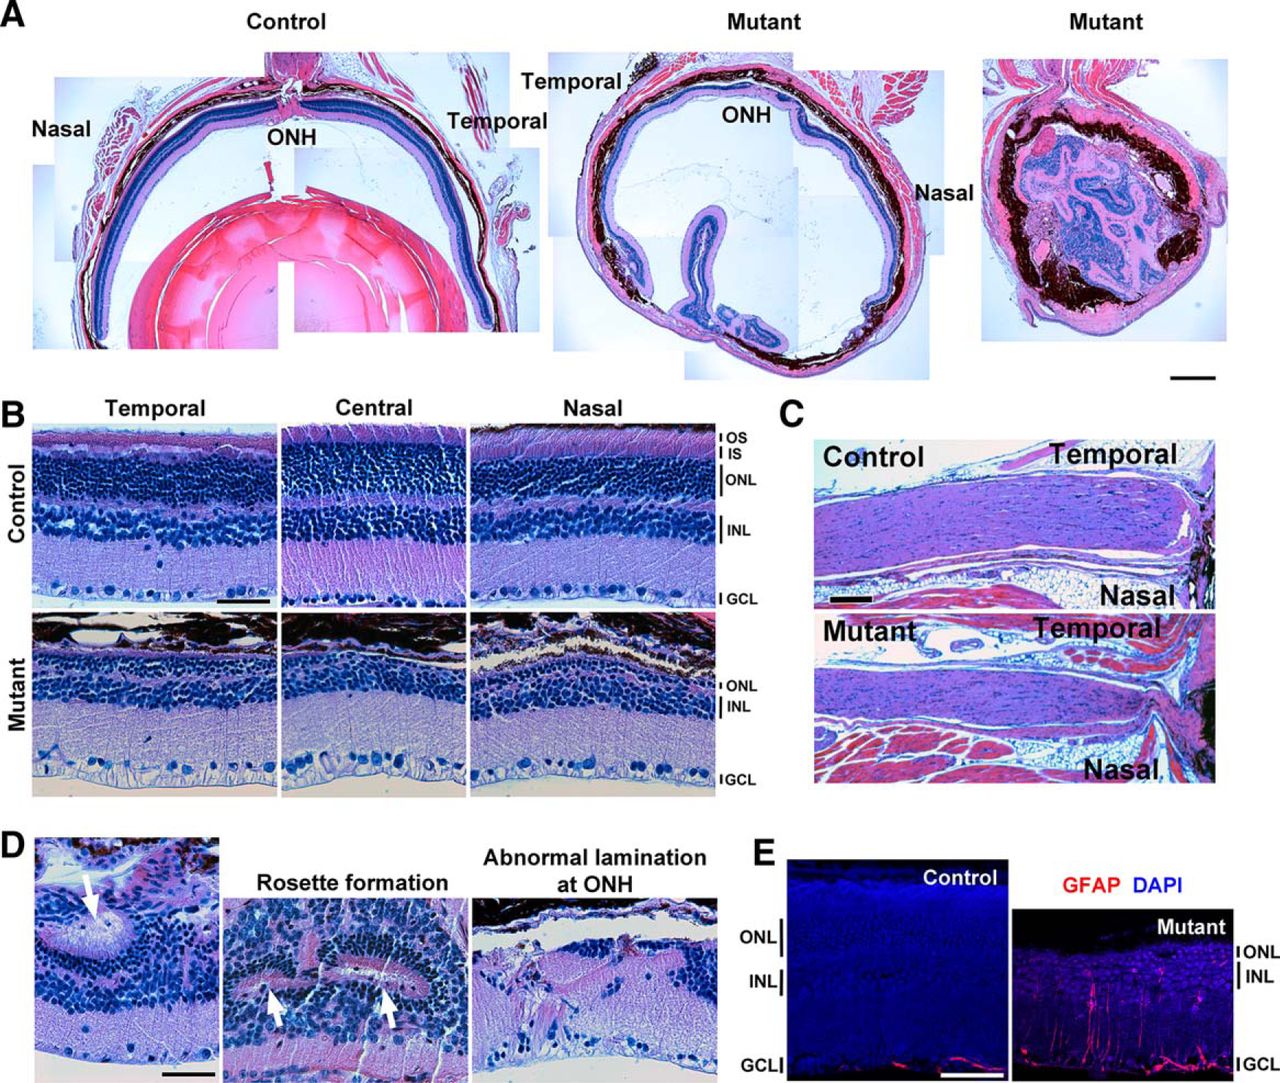
Nineteen-month Ikbkap CKOs displayed severe retinal degeneration. A, H&E staining showing a control and two mutant (CKO) eyes. Mutant eyes were smaller, and lenses were often absent; retinas showed obvious sign of degeneration. B, Retinal cross sections at temporal, central, and nasal retinas. Mutant retinas showed clear photoreceptor degeneration, indicated by the thinner ONL and the absence of IS and OS. The number of cells in GCL was reduced. C, CKO optic nerves were thinner. D, Abnormal retinal structures, such as rosette formation and dyslamination of the layers, were observed in the mutant retinas. E, IHC of the GFAP indicated Müller glial activation in the mutant retinas. Scale bars, 250 μm (A), 50 μm (B, D, and E), and 100 μm (C).
- Figure 4.
Six-month Ikbkap CKO retinas were grossly normal except for the reduction in RGCs. A, H&E staining showing control and mutant (CKO) eyes. The mutant eyes at 6 months appear normal. B, Retinal cross sections at central (>0.25 mm from ONH), middle (1 mm from ONH), and peripheral (1.75 mm from ONH) retinas in the temporal hemisphere. Retinal structure of the mutant was grossly normal, except for the reduction in cell number in the GCL that is apparent toward the peripheral retinas. C, Reduction in cell number was observed in the mutant GCL at 1 mm from the ONH (middle). Images of the temporal retina are shown. D, Mutant retinas showed reduced numbers of RGC marker, Brn3 (red). Islet1 (green) IHC showed normal cholinergic amacrine and optic nerve bipolar cells. E, Choline acetyltransferase (green) IHC showed normal number and structure of cholinergic amacrine cells. PKD2L-1 (red) IHC indicated normal photoreceptor cilia structure. F, Müller glial marker Sox9 (green), Sox2 (red), and GFAP (blue) showed normal, nonactivated Müller glia in the mutant retinas. G, Because of variability in the phenotype, degenerating mutant retinas were occasionally observed at 6 months. In these retinas, Müller glia were activated (GFAP upregulation), and photoreceptor rosettes were seen. D–G, Images represent 1 mm from the ONH at the temporal retina. Scale bars, 250 μm (A) and 50 μm (B–G).
- Figure 5.
Loss of Ikbkap in RGCs caused slow, progressive RGC degeneration. A, Representative Brn3 (RGC marker) staining in the temporal and nasal retinas at 6 months. Images were taken at 1 mm from ONH. B, The number of Brn3+ RGCs in Ikbkap CKO (mutant) retinas was counted. Significant loss of Brn3+ cells was observed in temporal and superior retinas at 6 months, which progressively spread into entire retinas by 14 months. C, The numbers of Brn3+ RGCs were counted in each quadrant of 6- to 8-month-old Cre-;Ikbkapf/+ and Cre+;Ikbkapf/+ retinas at 1 mm from the ONH. There was no significant decrease in the number of RGCs in Cre+;Ikbkapf/+ compared to Cre-;Ikbkapf/+ retinas, demonstrating that Cre expression itself and/or loss of one Ikbkap allele did not cause RGC degeneration. S, superior; N, nasal; I, inferior; T, temporal. Error bars represent SEM (n = ≥4 per point for B; n = 3 for C). *p < 0.05 with t-test. Scale bars, 100 μm (A).
- Figure 6.
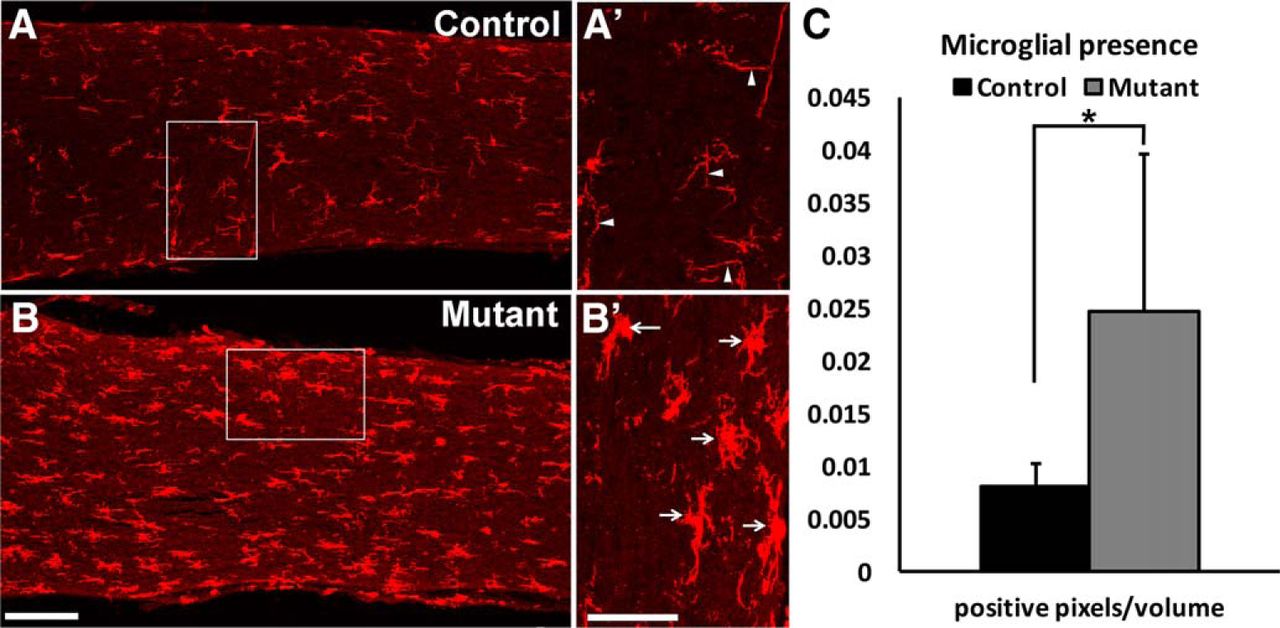
Activation of microglia was observed in the Ikbkap CKO optic nerves. Maximum-intensity z-stack projections of longitudinal optic nerve sections were stained with microglial/macrophage marker Iba1 in 9-month control (A) and mutant (B) optic nerves. Representative images are shown. Microglia in control optic nerves had thin ramified branches (arrowheads in Aʹ inset); microglia in mutant optic nerves had ameboid morphology (arrows in Bʹ) indicative of inflammatory response. White boxes in A and B indicate areas imaged at higher magnification in Aʹ and Bʹ, respectively. (C) The number of Iba1-positive pixels that met the criteria was counted and divided by the total number of pixels in the volume of the area, as described in Materials and Methods. The data show that mutant microglia occupied increased areas in the optic nerve, suggesting the presence of inflammatory response. *p = 0.05 with a two-tailed t-test (n = 6 for control and n = 5 for mutant). Scale bars, 100 μm (A and B) and 50 μm (Aʹ and Bʹ).
- Figure 7.
Melanopsin+ ipRGCs were resistant to degeneration. All images were taken at 1 mm from the ONH, and numbers of RBPMS+ (total RGC marker) or melanopsin+ (ipRGC marker) cells were counted manually in superior (S) nasal (N), inferior (I), and temporal (T) leaflets. A, At 6 months, the mean number of RGCs was significantly lower for mutant mice in superior and temporal retinas (p = 0.01 and 0.02 with ANOVA and Tukey’s honestly significant difference test). B, Representative RBPMS labeling of the 9-month control and mutant retinas. C, At 9 months, the mean number of RGCs was significantly lower for mutant mice in nasal, inferior, and temporal retinas (*p = 0.02, 0.03, and 0.02 with ANOVA and Tukey’s honestly significant difference test). D, Representative melanopsin labeling of 9-month control and mutant retinas. E, At 9 months, there was no significant difference in ipRGC counts between control and mutant retinas. F, Cre expression in melanopsin+ RGCs was analyzed in Tα1-Cre;mTmG Cre reporter retinas at P10. Ten melanopsin+ cells were found in three different Cre reporter retinas, and all 10 were GFP+, suggesting that ipRGCs express Cre. Two representative cells are shown (arrows). Error bars in A, C, and E represent SEM. Scale bars, 100 μm (B and D) and 50 μm (F).
- Figure 8.
Photoreceptor degeneration was observed in Ikbkap CKO retinas. The number of rows of photoreceptor nuclei in the ONL was counted at 0.25 mm from the optic nerve in the temporal and nasal retinas at 6 months (A), 9 months (C), and 14 months (E). H&E-stained cross sections. A and B, At 6 months, no sign of photoreceptor degeneration was observed. C and D, At 9 months, significant loss of photoreceptors and disorganization of ONL (arrowheads) in the mutant temporal and peripheral retinas were observed. E and F, At 14 months, the number of rows of photoreceptor nuclei was clearly reduced across the retina. In addition, photoreceptor IS and OS were absent. Error bars in A, C, and E represent SEM (*p < 0.05 with t-test). Scale bars, 50 μm (B, D, and F).


In this issue


